Are you feeling overwhelmed by the sheer amount of, or maybe lack of, reporting available in Google Performance Max? If so, you're not alone; navigating the reporting maze in Google Performance Max campaigns can be daunting, but it doesn't have to be.
This blog post offers a comprehensive guide to understanding and utilising Google Performance Max Analytics. We'll walk you through the basics of the different reports and performance max metrics available, along with those that are hidden but can provide essential insights. With this guide, you can make sense of the performance data and use it to make informed decisions about evolving your Performance Max e-commerce strategy. So, if you're ready to take control and make the most of Google Performance Max Analytics, read on!
Google Performance Max Reporting
Since the launch of Performance Max (PMax), Google has been steadily increasing its reporting capabilities and loosening its grip on the platform by offering more options to improve and track Performance Max results. This has led to more discussions about the campaign-level reporting features available and how to piece them together. Additionally, reporting features are essential when diagnosing poor performance, which we've covered in another post Diagnosing & Overcoming Common Issues with Google Performance Max: Workarounds & Solutions.
Performance Max Campaign Metrics
We'll start with the Performance Max campaign metrics to kick things off. These are what you'll use to gauge the overall success of your campaign, as these provide an overview of the top-level performance, such as ad clicks, impressions, click-through rate, cost-per-click, cost, conversions, cost-per-action, conversion rate, value per conversion, revenue and Return on ad spend (ROAS).
However, seasoned Google Advertisers will note that some metrics, such as Search Impression Share and other associated metrics, are missing to gauge your place in the search results against your competition. This has made it more difficult to estimate your search potential for growth. These metrics were crucial in calculating the likely effects of becoming more aggressive with your bid strategy or allocating additional budget to your campaign(s).
This leads us to need budget and bid strategy reporting to ensure that campaigns run as efficiently as possible.
Performance Max Budget & Bid Strategy Report
Beginning with the basics, this isn't a report on results as such, but something you can use to consider adjusting bidding strategies and budgets in the absence of impression share metrics.
Because Performance Max campaigns are an automated 'black box' system, Google will optimise your campaigns most effectively when it has the flexibility to capture conversions. So it's essential to keep a close eye on any flags for budget constraints, especially after launching new campaigns, to ensure you get a fair test and do not miss out on conversions.
The 'Bid & Budget Report' in Performance Max is available at the campaign level. It will give you insights into what adjustments may be necessary and the potential impact following any adjustment with the 'Campaign Target Simulator'. This will depend on the bid strategy you have in place but will combine potential targets with your budget to indicate the likely impact of changes.
The campaign target simulator can be accessed by hovering over the icon, under the budget column while viewing the list of your campaigns in your Google Ads interface. Below is a sample screenshot of the Campaign Simulator report.
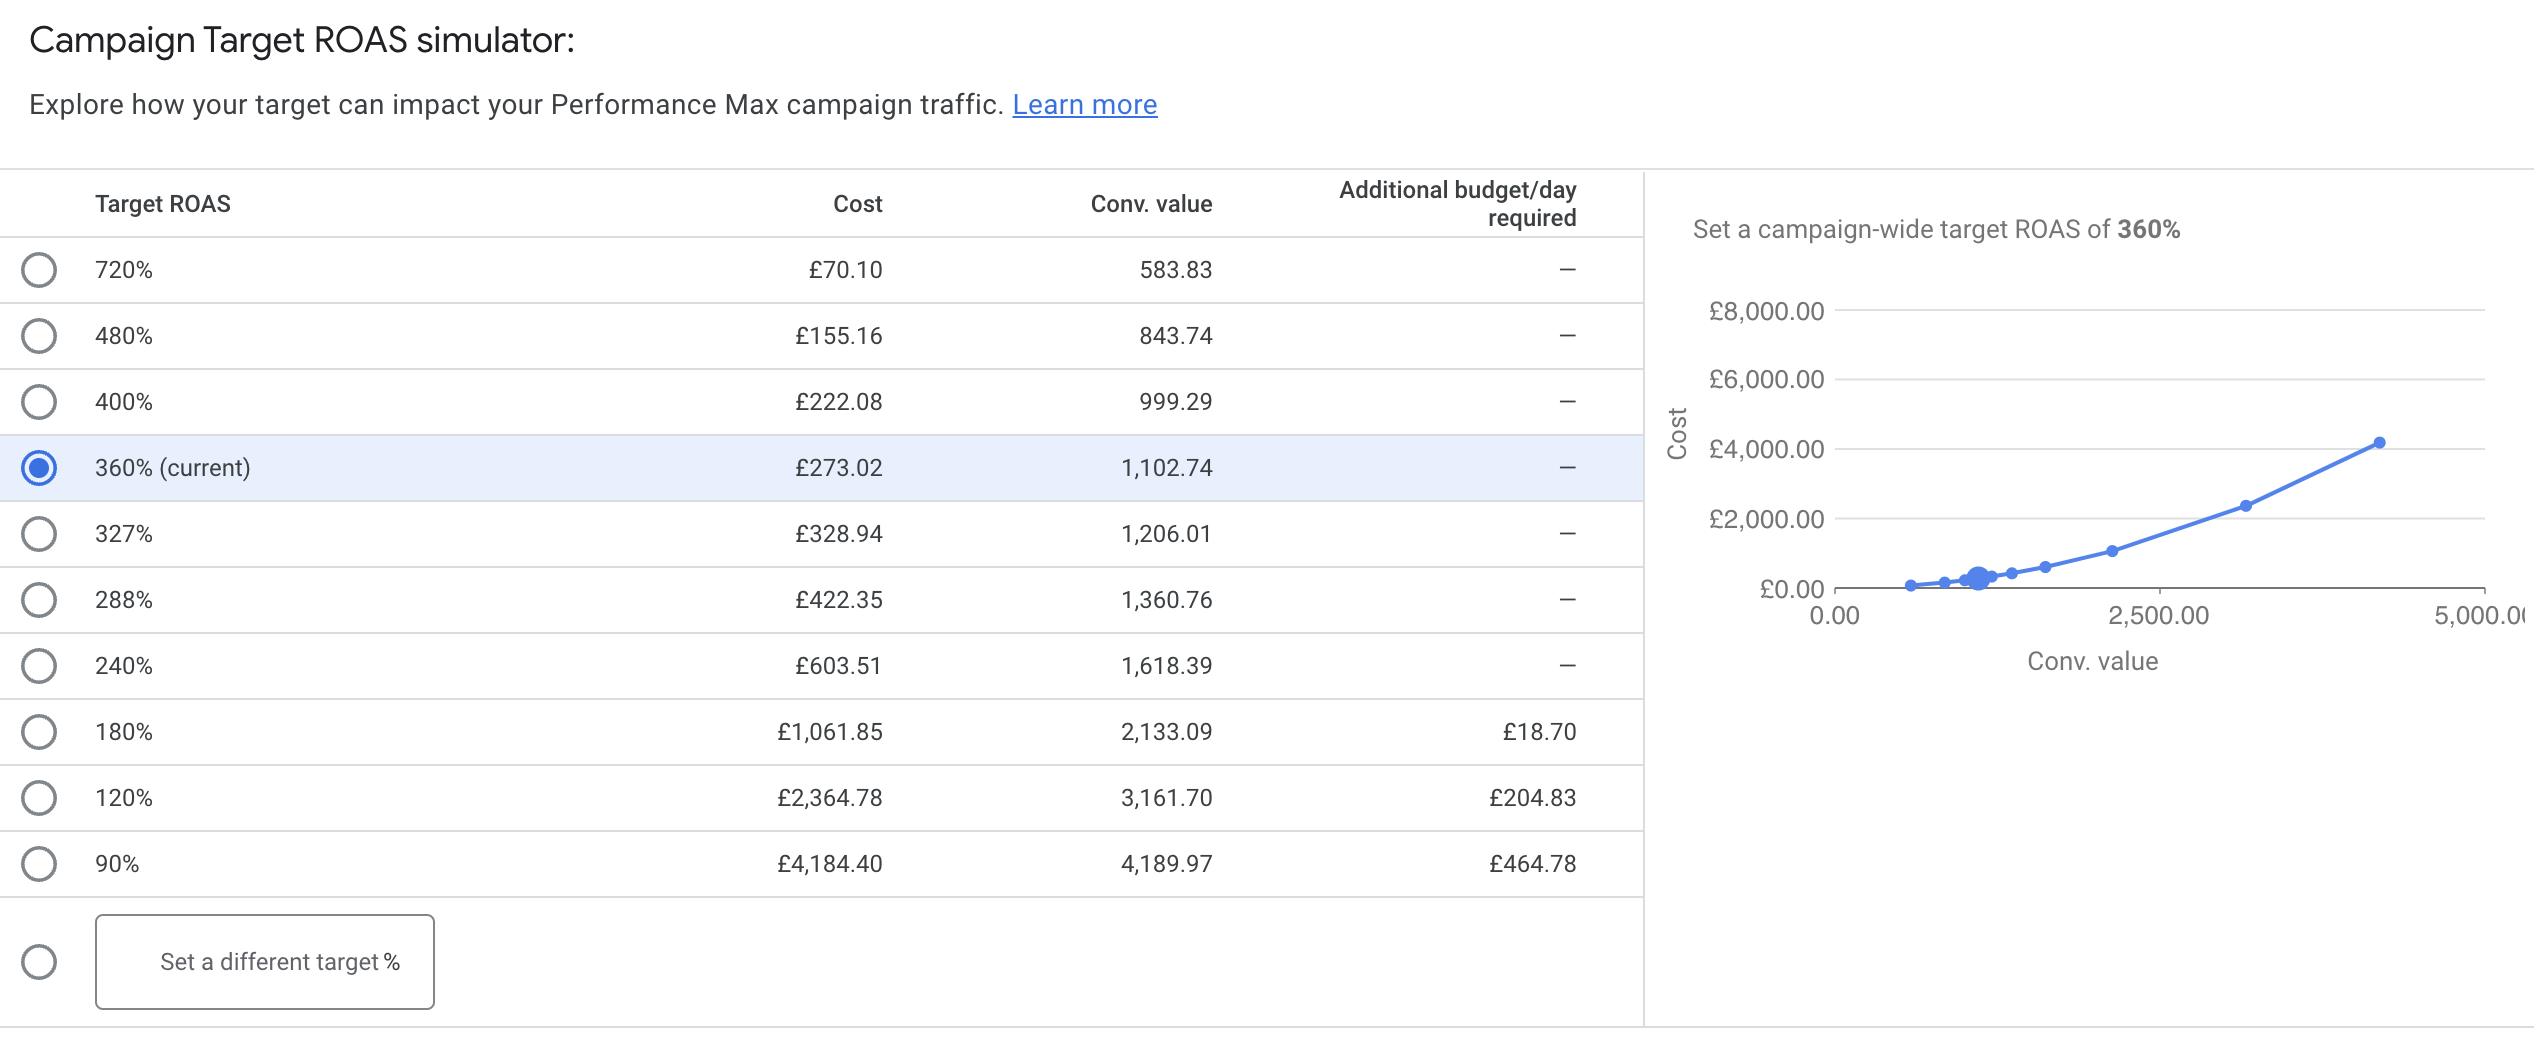
In many cases, an increase in your ROAS target may result in fewer clicks and, as a result, fewer conversions and less revenue. Conversely, relaxing your bid strategy constraints, so reducing your ROAS target, will likely increase traffic and conversions and cost. This report will tell you what budget you must add to any proposed settings.
Location Reports In Performance Max
Suppose you're using location targeting, which is highly recommended even if you sell a global product. In that case, you can view the detailed performance of your location targeting on the 'Locations' tab.
Navigate to one of your Performance Max campaigns, and click 'Locations' in the left-hand menu of your Google Ads interface. Once you are in the location report, you'll see traffic by targeted location.
Initially, the report view will be data for your 'targeting', not precisely the physical location of the audiences who have clicked your ads. Click the drop-down which says 'Targeted locations' and select 'Matched locations' This will then update the report to show the physical locations of users who clicked your ads, not just the locations you are targeting.
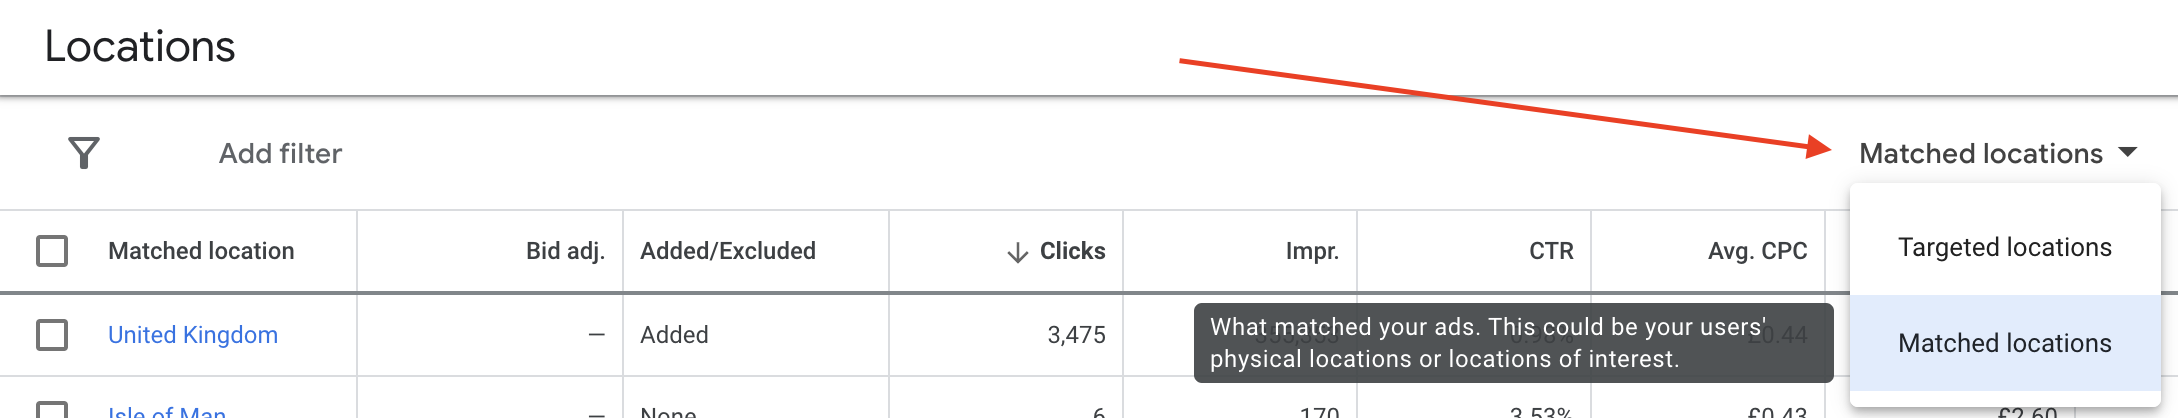
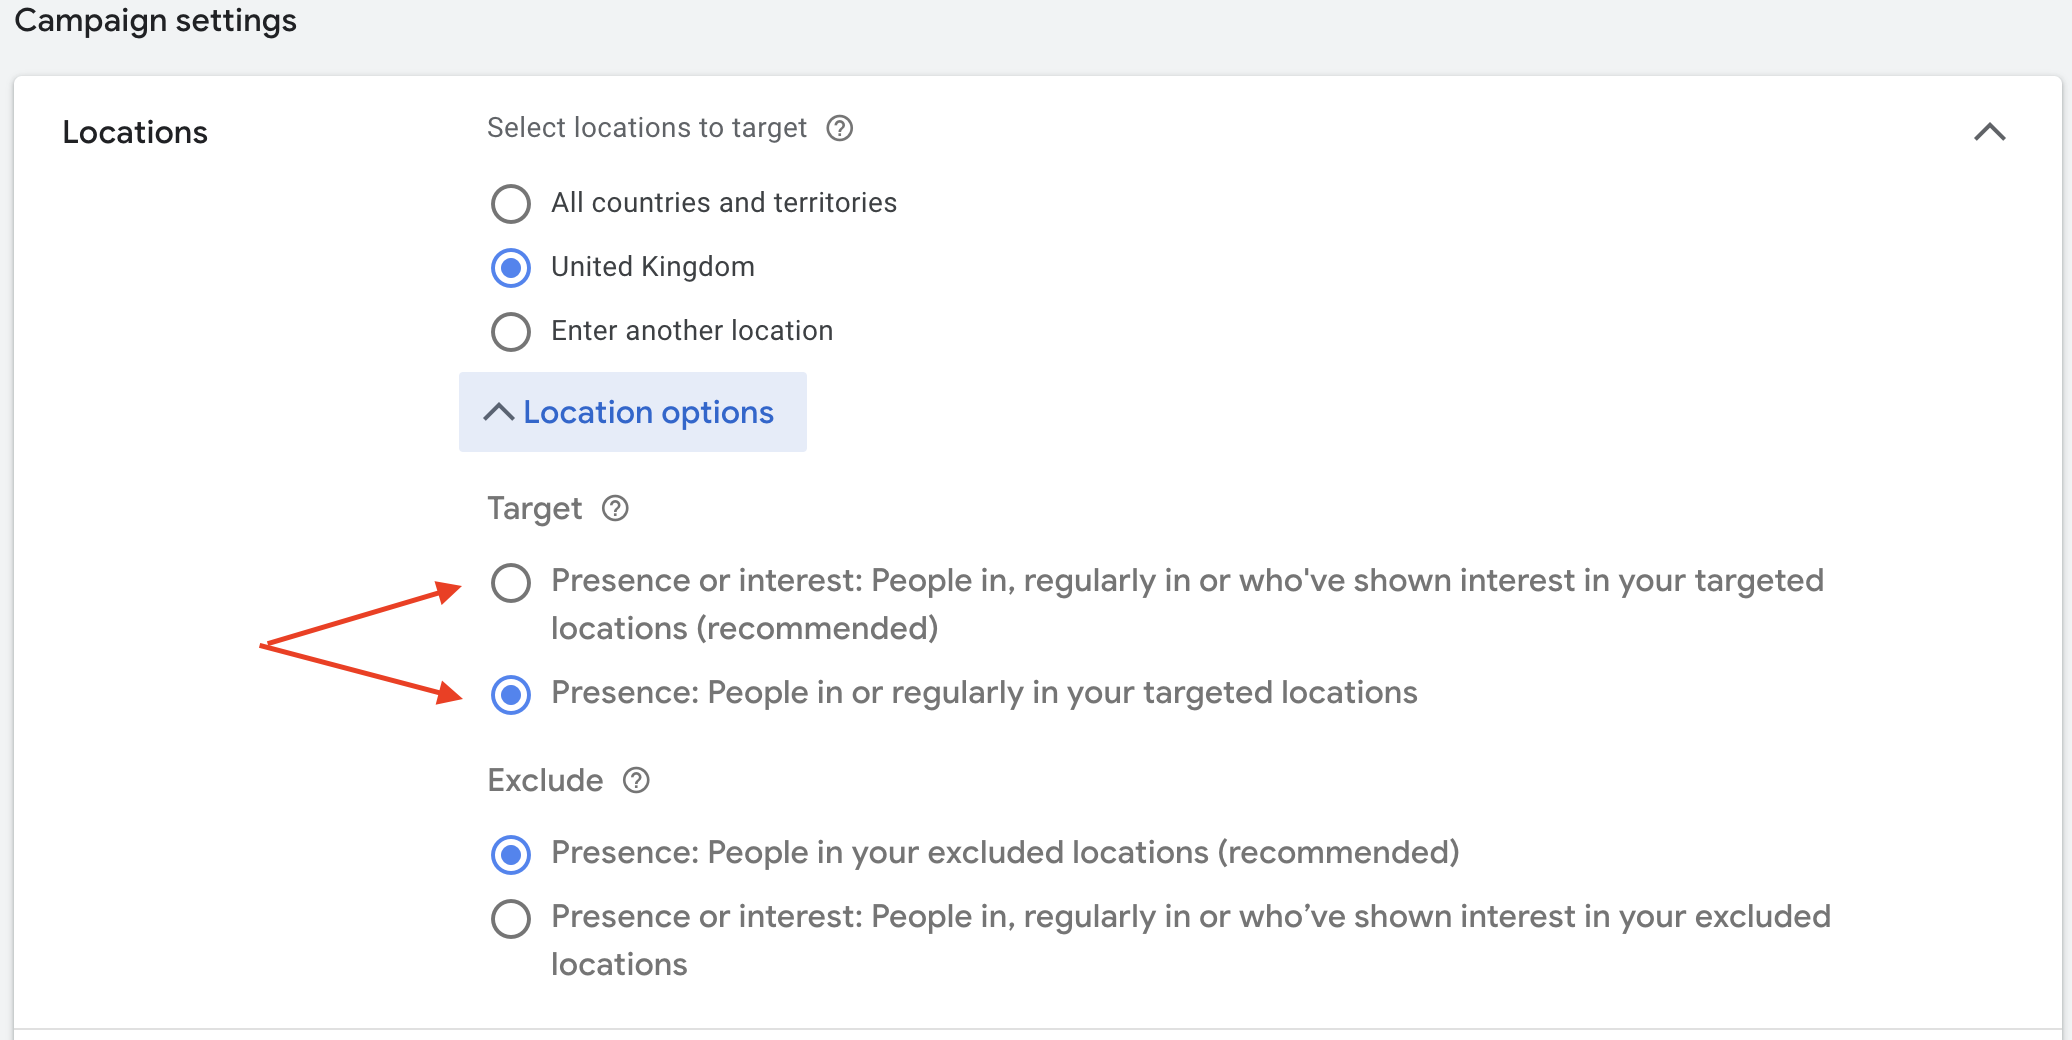
From this view, you can report on location performance and identify if your ads are being served in locations you didn't expect or want. For example, any clicks from unwanted areas should prompt you to check your location settings. This could lead to the diagnosis of your location targeting options set to interest instead of presence.
Ad Scheduling Reports In Performance Max
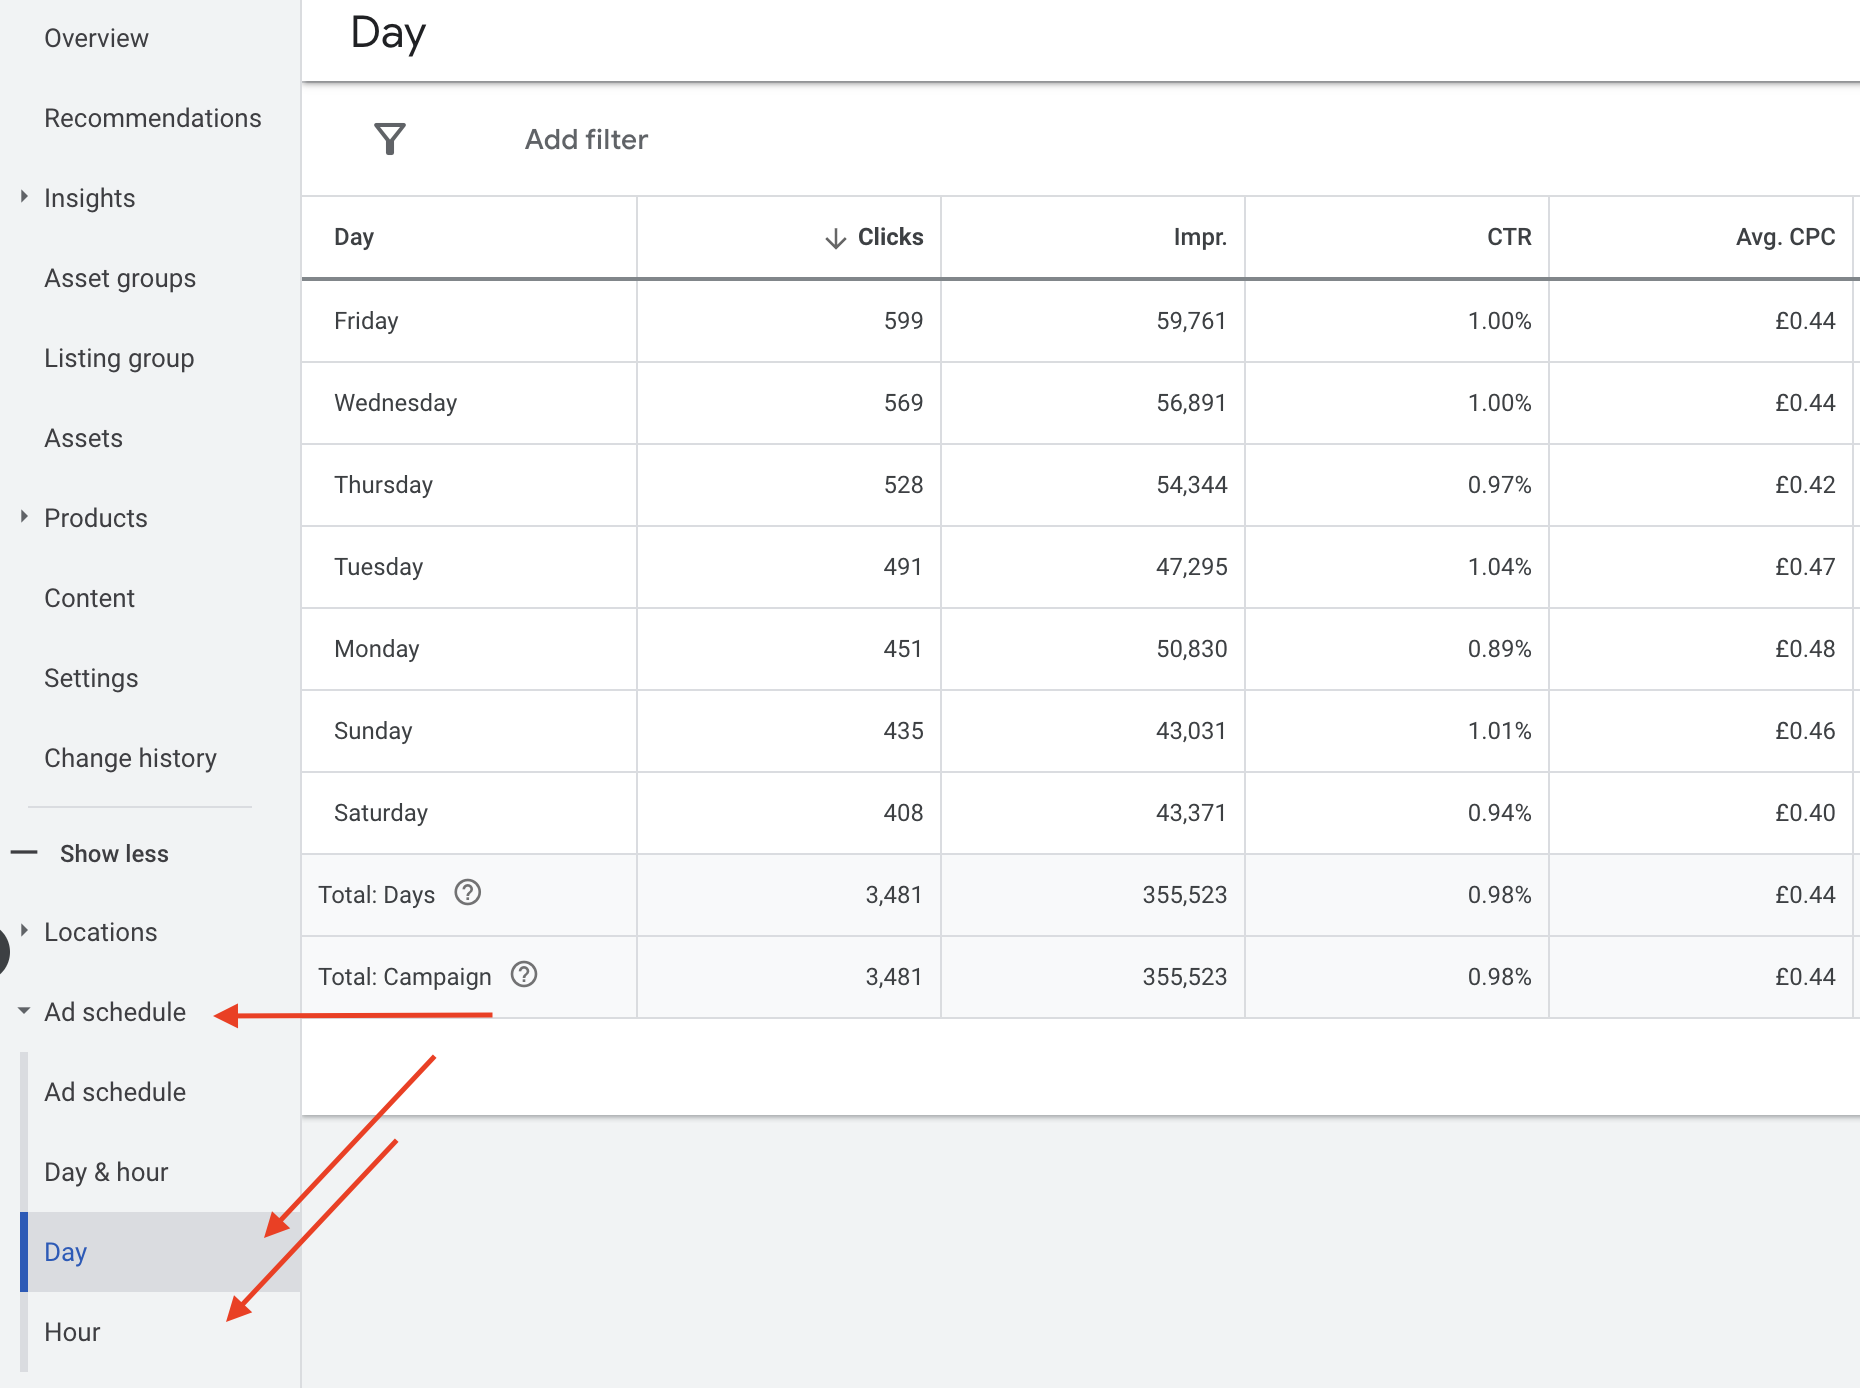
Another report which is standard in Google Ads is the Ad Scheduling report. This is an invaluable tool for advertisers, enabling you to report on performance by hour-of-day, day-of-week, and day and hour combined. This information can be used directly in your Performance Max campaign settings, as PMax allows you to control when your ads show, by either day of the week, the hour of the day, or a combination of both.
This report is accessed via the left-hand menu in your Google Ads interface while within one of your Performance Max campaigns. Then from here, you can select your view of performance by 'Day', 'Hour', or a combination of both with 'Day & hour'. With this data, you'll be able to assess the best and worst times for your ads to be served.
You can create a custom ad schedule from your analysis, essentially telling PMax exactly when you want it to run. Having said this, when you have been running PMax for some time, the algorithm should learn from conversion data and throttle back at times when sale performance is weak. Nonetheless, you can check back here to ensure it is throttling or take the leap and make a change to prevent spending if your budget is tight.
Reporting By Ad Network Type In Performance Max
As you should already know, Performance Max does its own thing to optimise how your budget is spent on search ads, shopping ads, and static ads. Retail campaigns should have a product feed attached to power your shopping ads, and you'd expect most of the traffic to come from this ad network type, being the bottom of the funnel. However, this isn't always the case, and it's essential to report on your traffic and sales by ad type to ensure that your budget is being spent efficiently.
Finding Your Traffic Split Between Shopping Ads & Other Ad Types
By looking in the right places and doing a few basic calculations, you can quickly determine what percentage of your budget is spent on shopping ads versus other ads in Performance Max. Additionally, you can get an idea of how many of your sales are coming from shopping ads.
With this information, you can evaluate if the spend/return ratios are on point or if there is a significant amount of wasted spending outside shopping ads that must be addressed. This information can be invaluable in helping you make the most of your budget and ensuring that your PMax ads are as effective as possible.
Free Report
Spot Errors, See Strategies,
Our Free Report Reveals Key E-Commerce Fixes.
Book Your Call
Calculating Traffic From Listing Groups
To make these calculations, you'll need to look and note the numbers in a few places. First, head into one of your PMax campaigns and look at the overview Tab. Set your metrics to view over an ideal period, then take note of cost and revenue. If you are more curious about volume, you can use any other metrics available for comparison.
With the above step completed, head over to the reports tool of your Google Ads account, and in the Pre-Defined Reports list, under the Shopping heading, select the 'Shopping - MC ID' report.
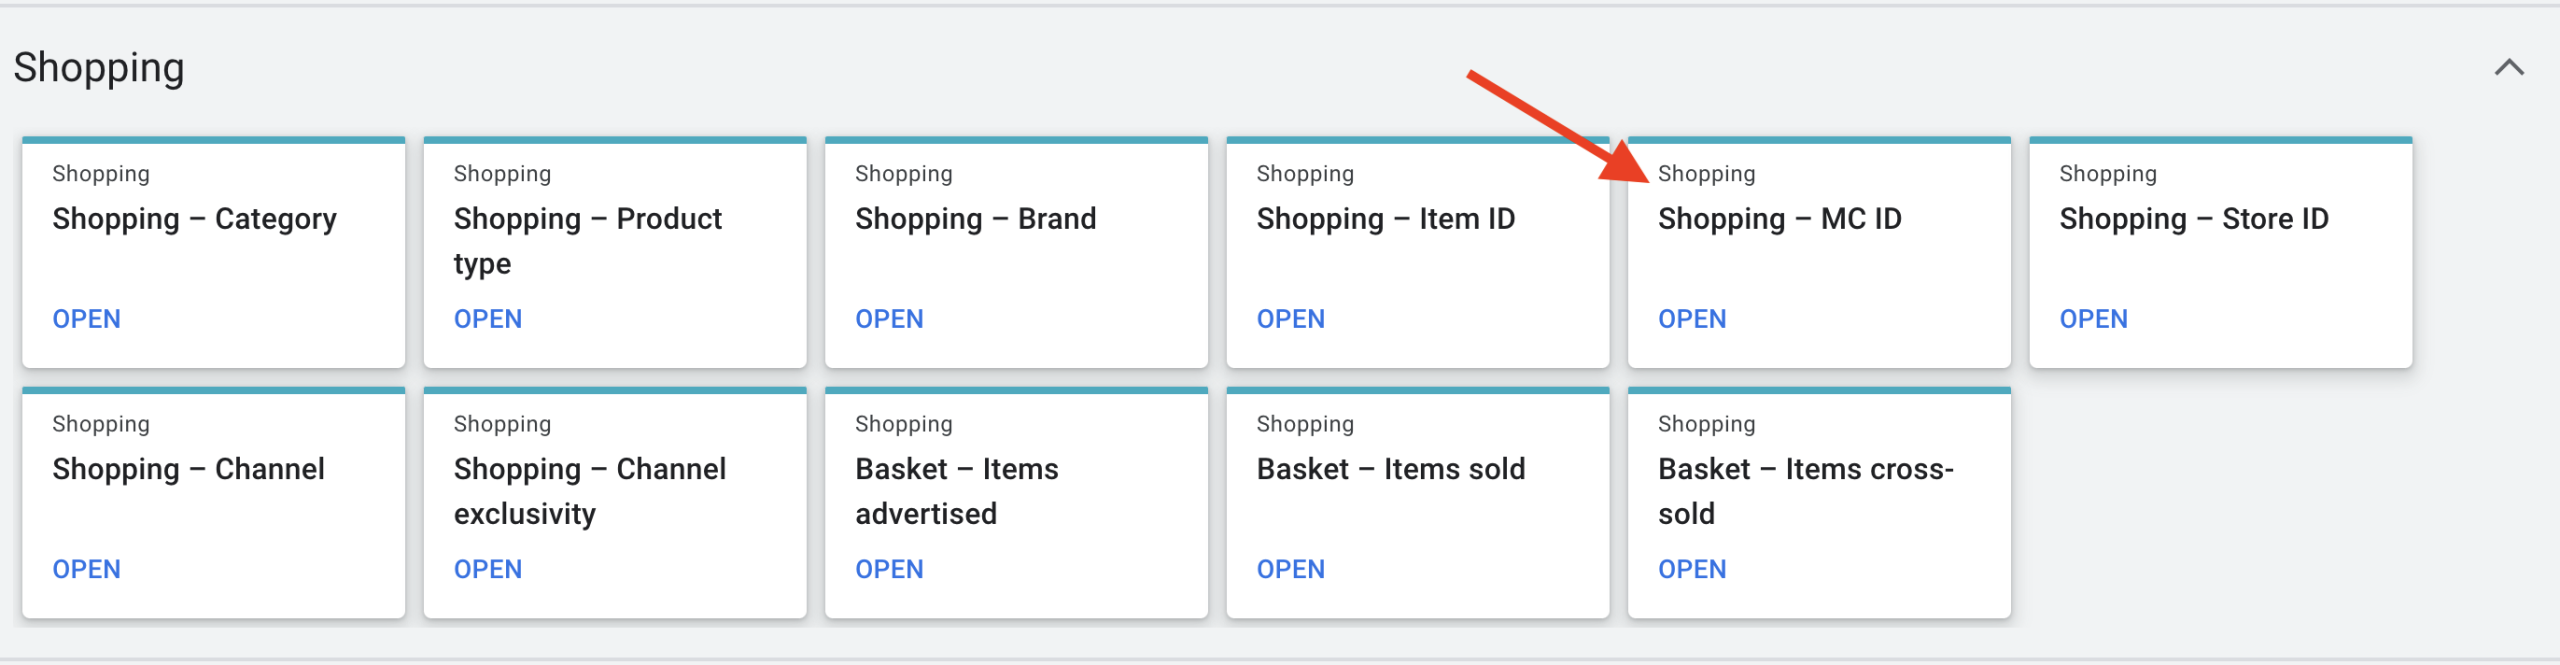
This report only shows you metrics for traffic from your Google Merchant Centre account. You will, however, need to apply a filter to make sure you are viewing data for the specific Performance Max campaign you are assessing and make sure you are viewing the same period as when you noted your top-level campaign metrics.
Note Cost and Revenue, and subtract this from the same metrics from the campaign overview. You'll then be able to determine the portion of traffic, cost, sales, and revenue from shopping ads from your campaign totals.
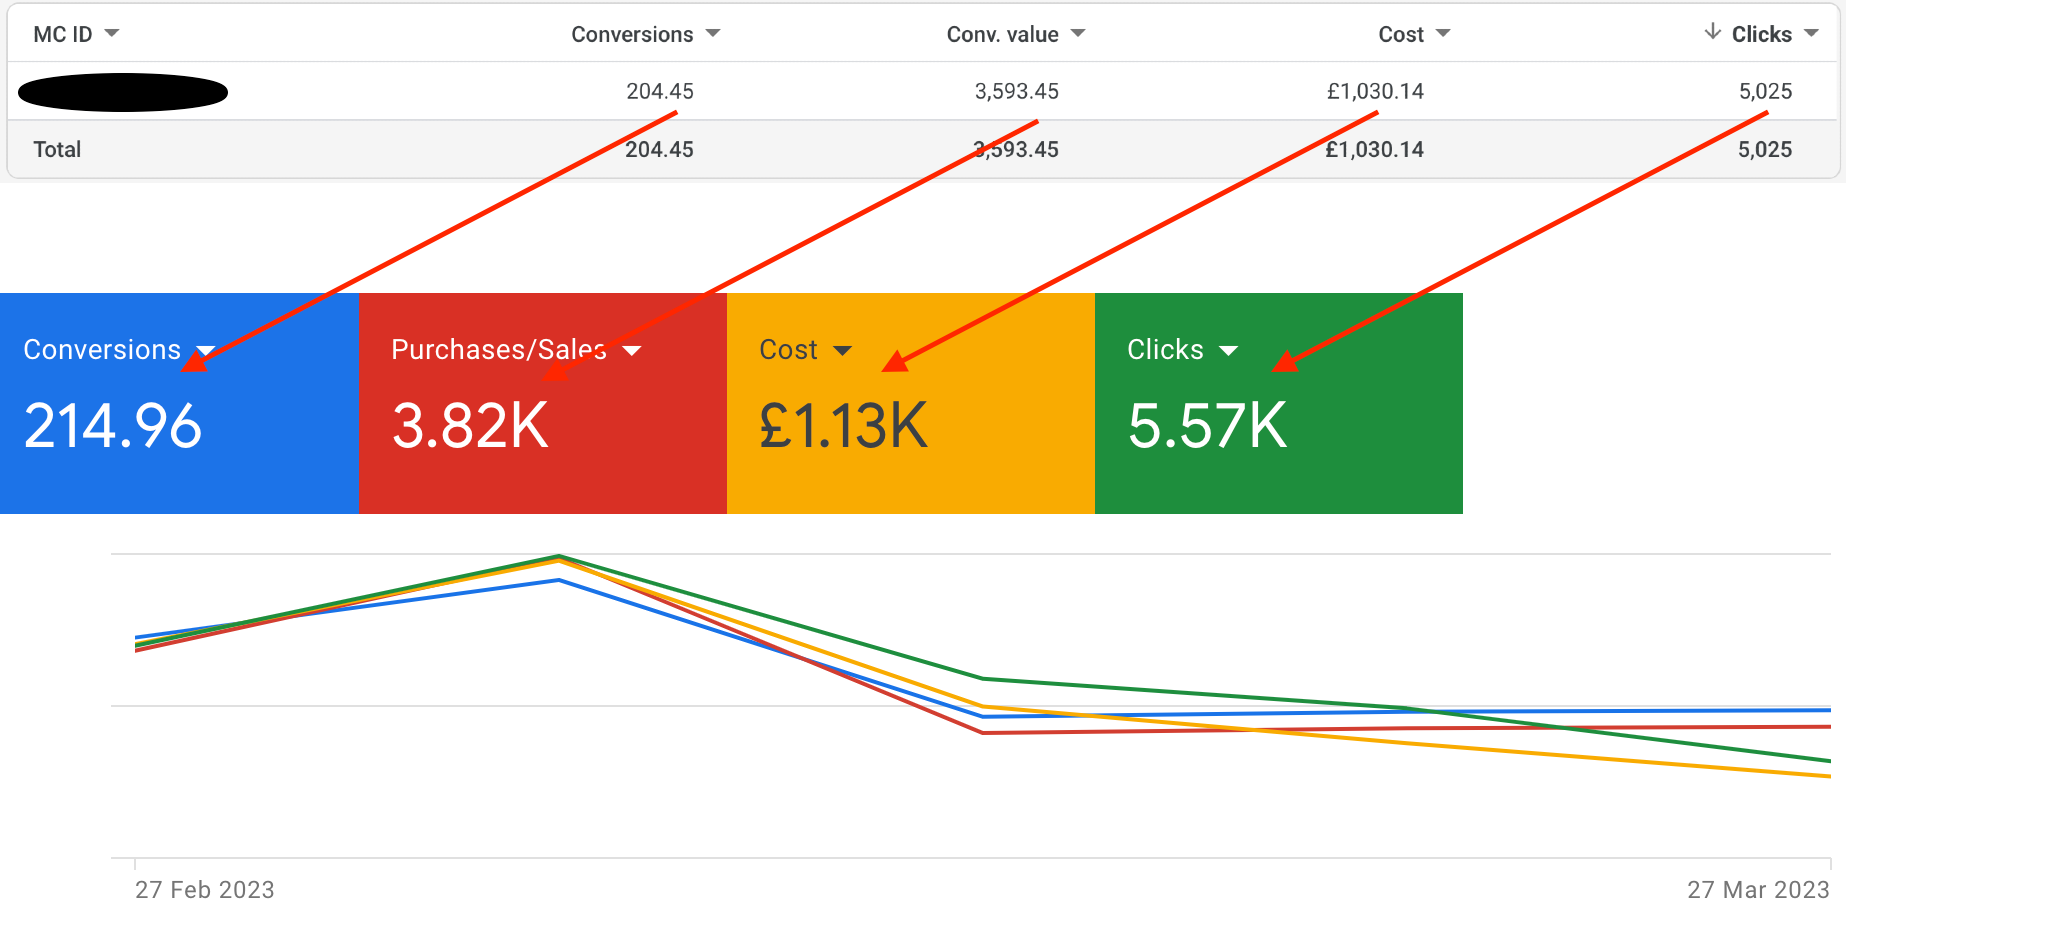
Any budget, traffic, or conversions you calculate to come from outside your Merchant Centre ID will be from 'other' ad types in Performance Max. This could be text ads on search engine results pages, Display, YouTube, or Discovery ads on other placements.
With this knowledge, you can decide which lever to pull. For example, you may want to set up Performance Max to behave like a 'Smart Shopping' campaign. We've covered this in another post, so if you want to know more, check out this post about Google Performance Max & Smart Shopping.
Getting More Granular With Hidden Reporting Of Performance Max
So far, we've covered the basics, most of which are used for gaining an overview of campaign-level traffic and performance. From here, we will get more into the depths of individual asset groups and audiences. From these reports, you'll be better placed to explain any traffic growth and changes in performance and perhaps gain insights into those bad days of sales that seem to come out of the blue.
Asset & Asset Group Reporting
Asset Groups are a great way to communicate the right messaging to your key audiences. A recent release in Performance Max is the reporting of the top-level performance of each asset group. With this latest release, two reports are available for asset groups. One is the report on asset resources used to create ads within your asset groups. As you know, the creatives of your asset group are used to assemble all of your ads for all applicable ad formats, similar to what seasoned Google advertisers will know as Responsive Search Ads mashed with Responsive Display Ads. The other is top-level performance metrics for each of your asset groups.
To learn more about Asset Groups and Ad Assets, read our Guide To Google Performance Max Assets & Asset Groups' or read on if you are ready to learn what reports are available to assess your creative assets.
Inside The Asset Detail Report
The Asset Detail is essentially asset reporting, providing you with the information needed to tailor your message to your audiences, view the performance rating of each asset, and identify any issues. To access this asset report, navigate to the asset groups within one of your Performance Max campaigns, and click on the 'View Details' link for the asset group you'd like to assess.
You'll then see a table reporting your assets within the asset group. In the asset column, you can find the content of each asset, along with the asset type column identifying headlines, descriptions, and images. The performance column ranks assets as low, good, and best. Assets labelled "pending" don't have enough data for Google to grade yet.
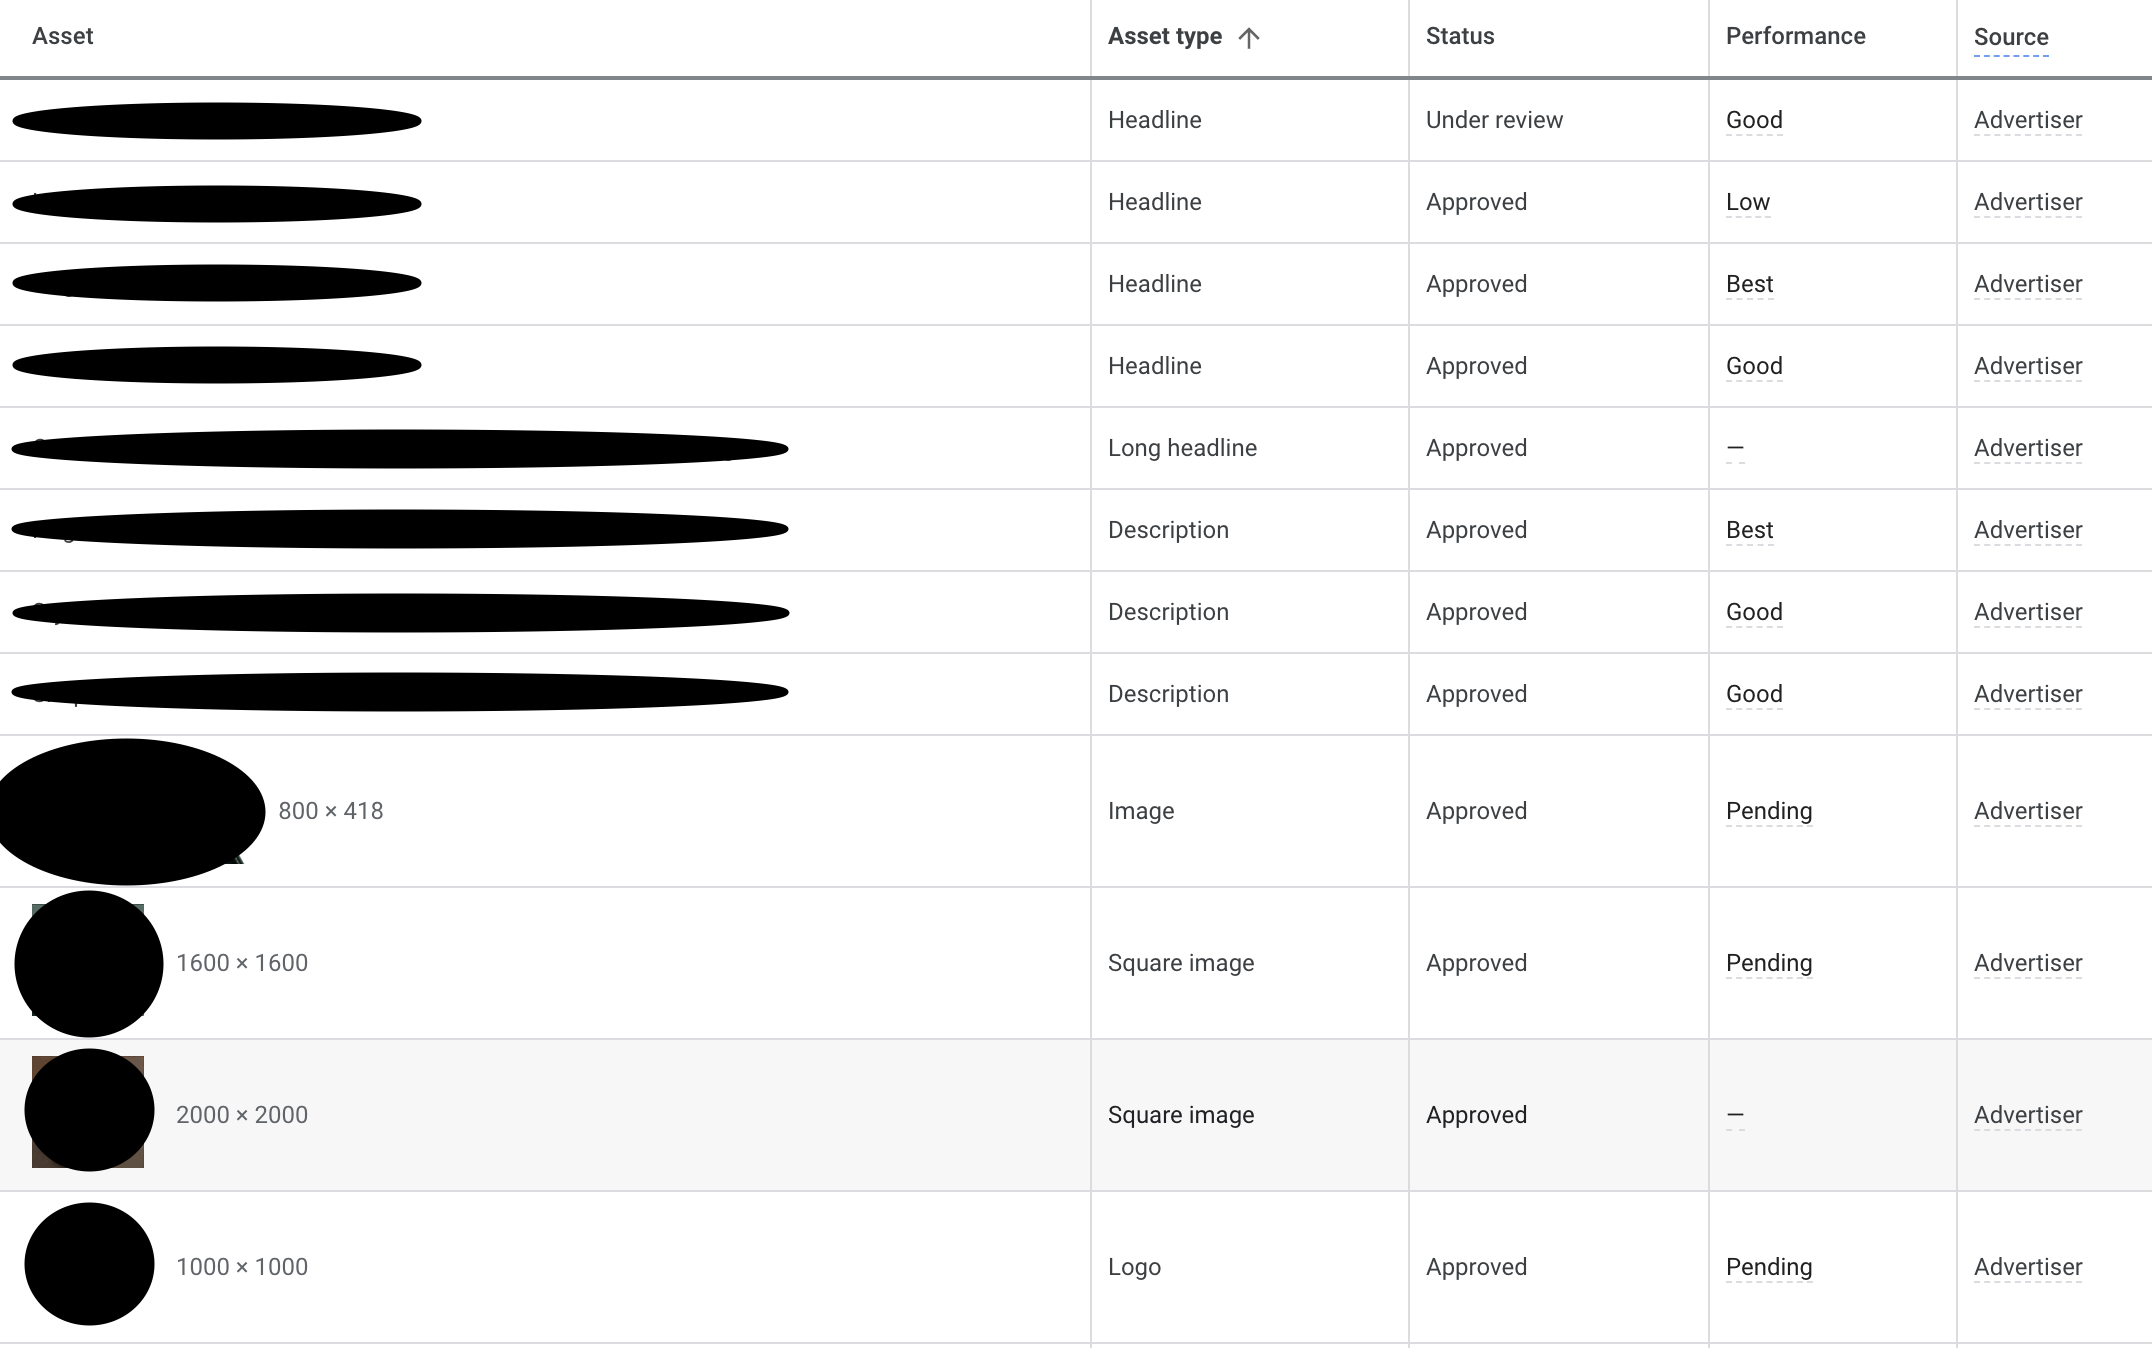
This is all you have concerning any measurement of the performance of your assets. You can replace the assets labelled 'low' performance to improve your campaign's performance with new ones. Deleting low-performing assets without replacing them isn't recommended, as this may limit ads served by your campaign. And remember, the performance reported for each asset is compared to other assets of the same type in the asset group, Not performance relative to your competitors' assets.
If you find any policy violations in your asset group, you can check them by hovering over the "status" column, and Google will provide further information about the policy approval status.
Asset Combinations Report
The report discussed above provides you with the performance of your assets and, of course, what Google's view of them is. When assessing the appropriateness of your assets for your target audiences, the human touch is needed to consider context and how they all work together.
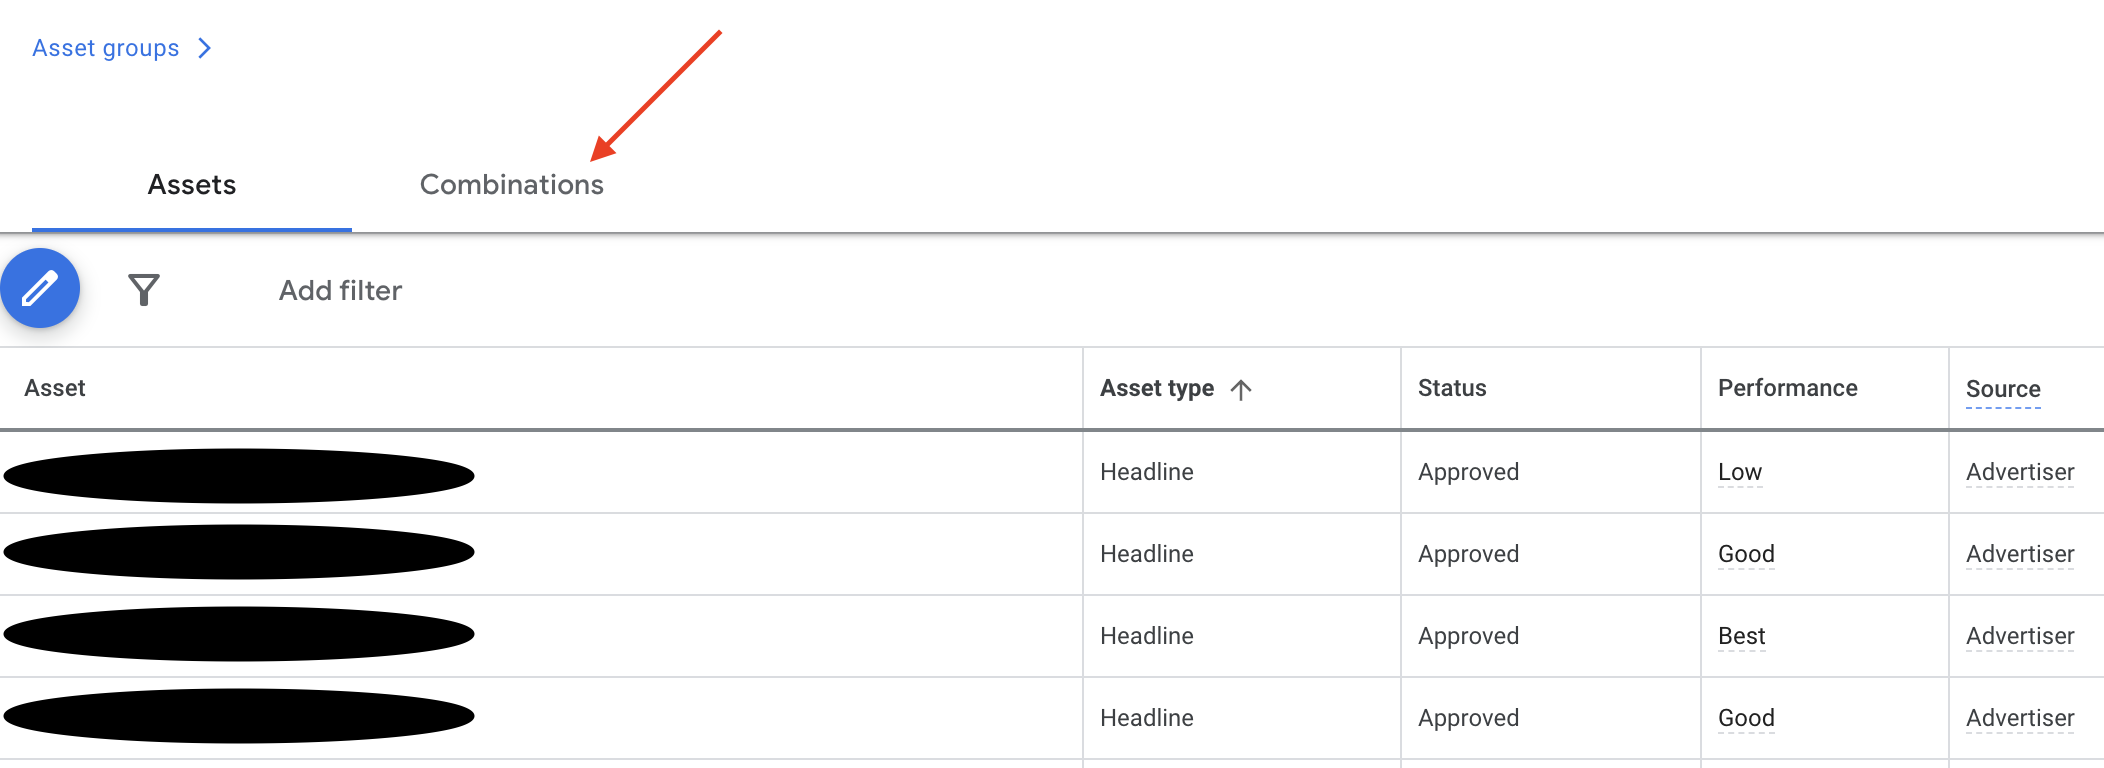
The Combinations Report is great to visualise the top-performing asset combinations for each asset group in your Performance Max campaign. To preview the most popular asset combinations on different ad networks, click the combinations tab while viewing the asset group details described above.
You can toggle the date range to get a feel for if Google is settling on any combination or if it's changing, and you can think about how the messaging is pieced together from your assets and how this resonates with your target audience.
This is an excellent tool for reviewing your overall message and checking to make sure your assets are making sense when served together and you are making the most of your ad real estate available.
Getting Started With
Performance Max
Download Our Step-by-step guide to getting started with Performance Max Shopping Campaigns for your Shopify Store
GET YOUR FREE EBOOKFREE EBOOK
Reporting On Listing Groups By Asset Group
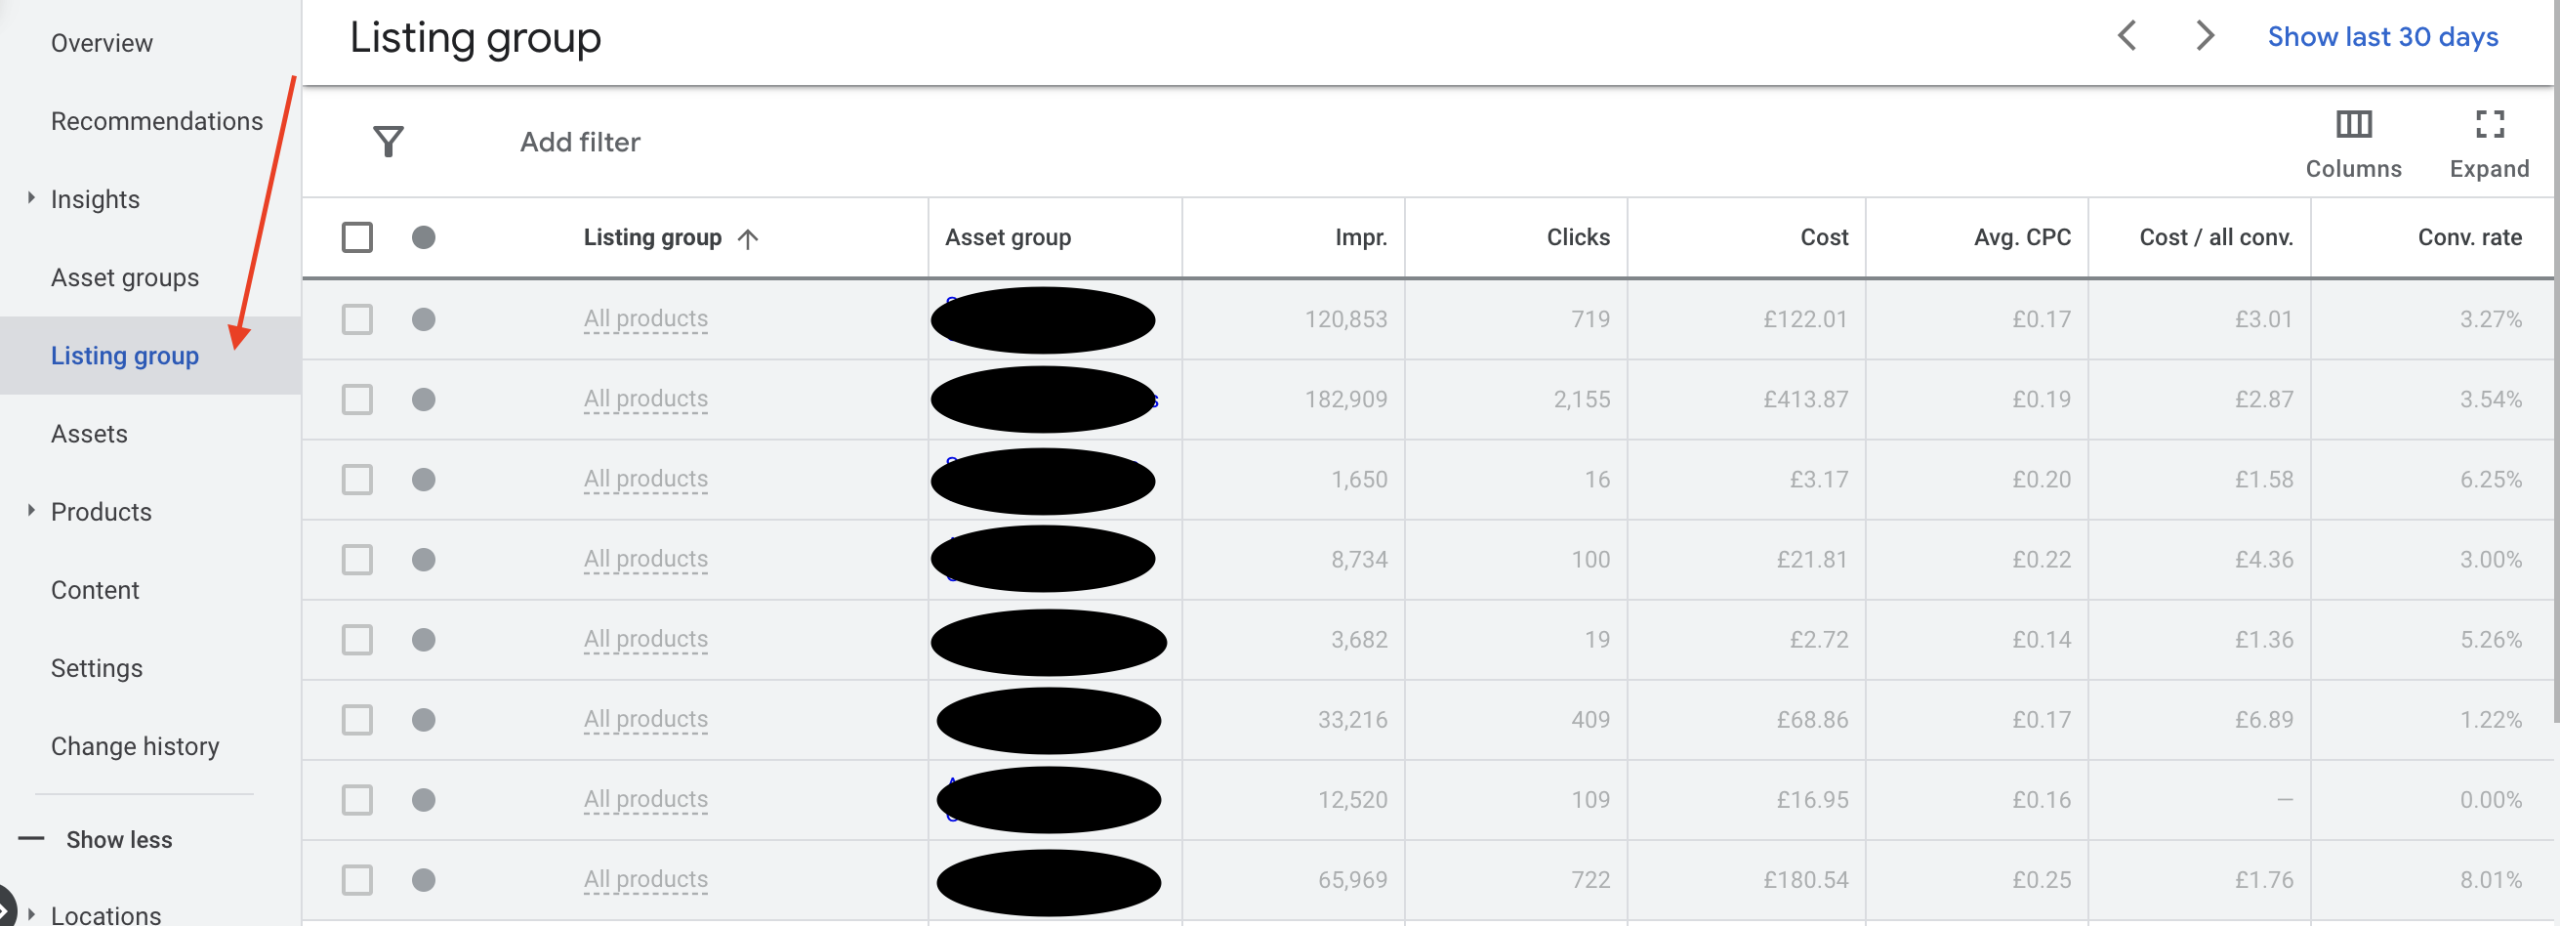
If you're looking to gain insight into your asset groups' performance and have a product feed added to your campaign, you're in luck! You can view asset group performance in the Listing group tab. Remember that this data is only for Shopping ads, so if you've divided up your product catalogue to meet a specific strategy, you can get an idea of what's going on with your Shopping ad traffic by asset group.
To view listing group performance by asset group, click into one of your Performance Max Campaigns, then navigate to 'Listing Group' in the left-hand menu. The following report will display product performance by asset group.
Performance Max Insights Reporting
Now we get into insights, which offer some views into the audience categories Performance Max is going after alongside search activity in the search engines. These insights can be used to explain changes in performance and help identify new opportunities to scale your Performance Max campaigns.
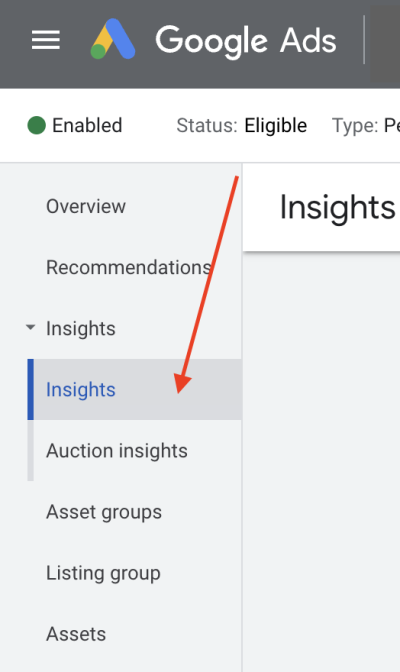
In the left navigation of your Google Ads interface, you will find Insights. You can access this at the account level, which will then report aggregated data for your whole account, or you can access this within a Performance Max campaign to get data at the campaign level.
As you click into the Insights tab, you can select either a week-over-week (last seven days) or month-over-month (previous 28 days) view. You'll see a table below populated with conversion value, cost, ROAS, and conversions for your selected period and how this has changed against the previous period for the campaign. This is also accompanied by 'top insights', which you can dig into further using the more detailed reports down the insights page.
View Performance by Asset Group In Performance Max
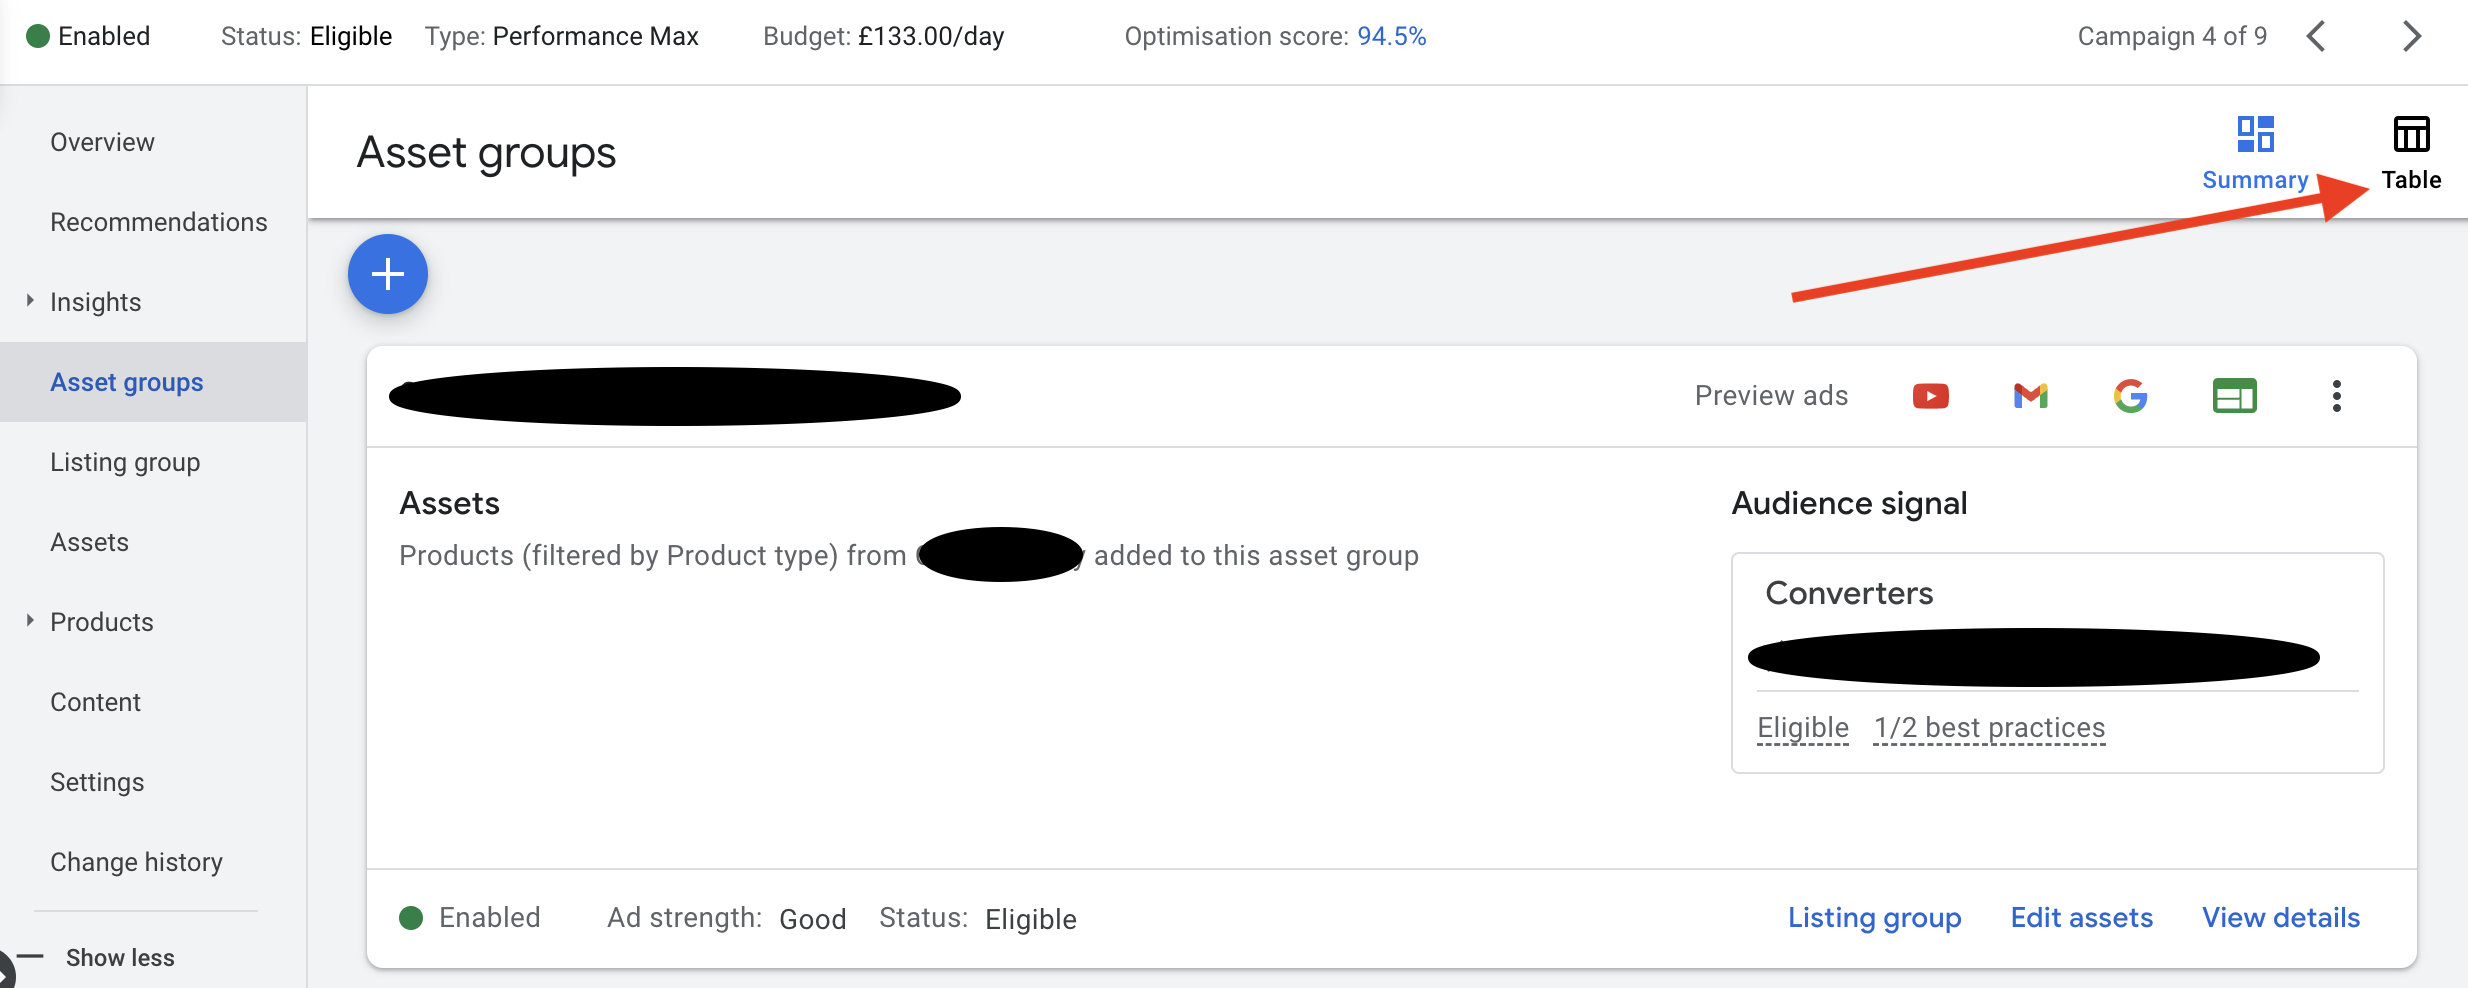
**Update 5th May 2023**Since this post was originally published, Google has updated the reporting in Performance Max campaigns, and you can now see traffic and performance metrics by Asset group. This, however, isn't obvious to find if you don't know where to look.
Access your Performance Max campaign, and click on the 'asset group' tab in the left menu of your Google Ads interface. This will show you the familiar summary of your asset groups, but next, toggle your view to 'table'.
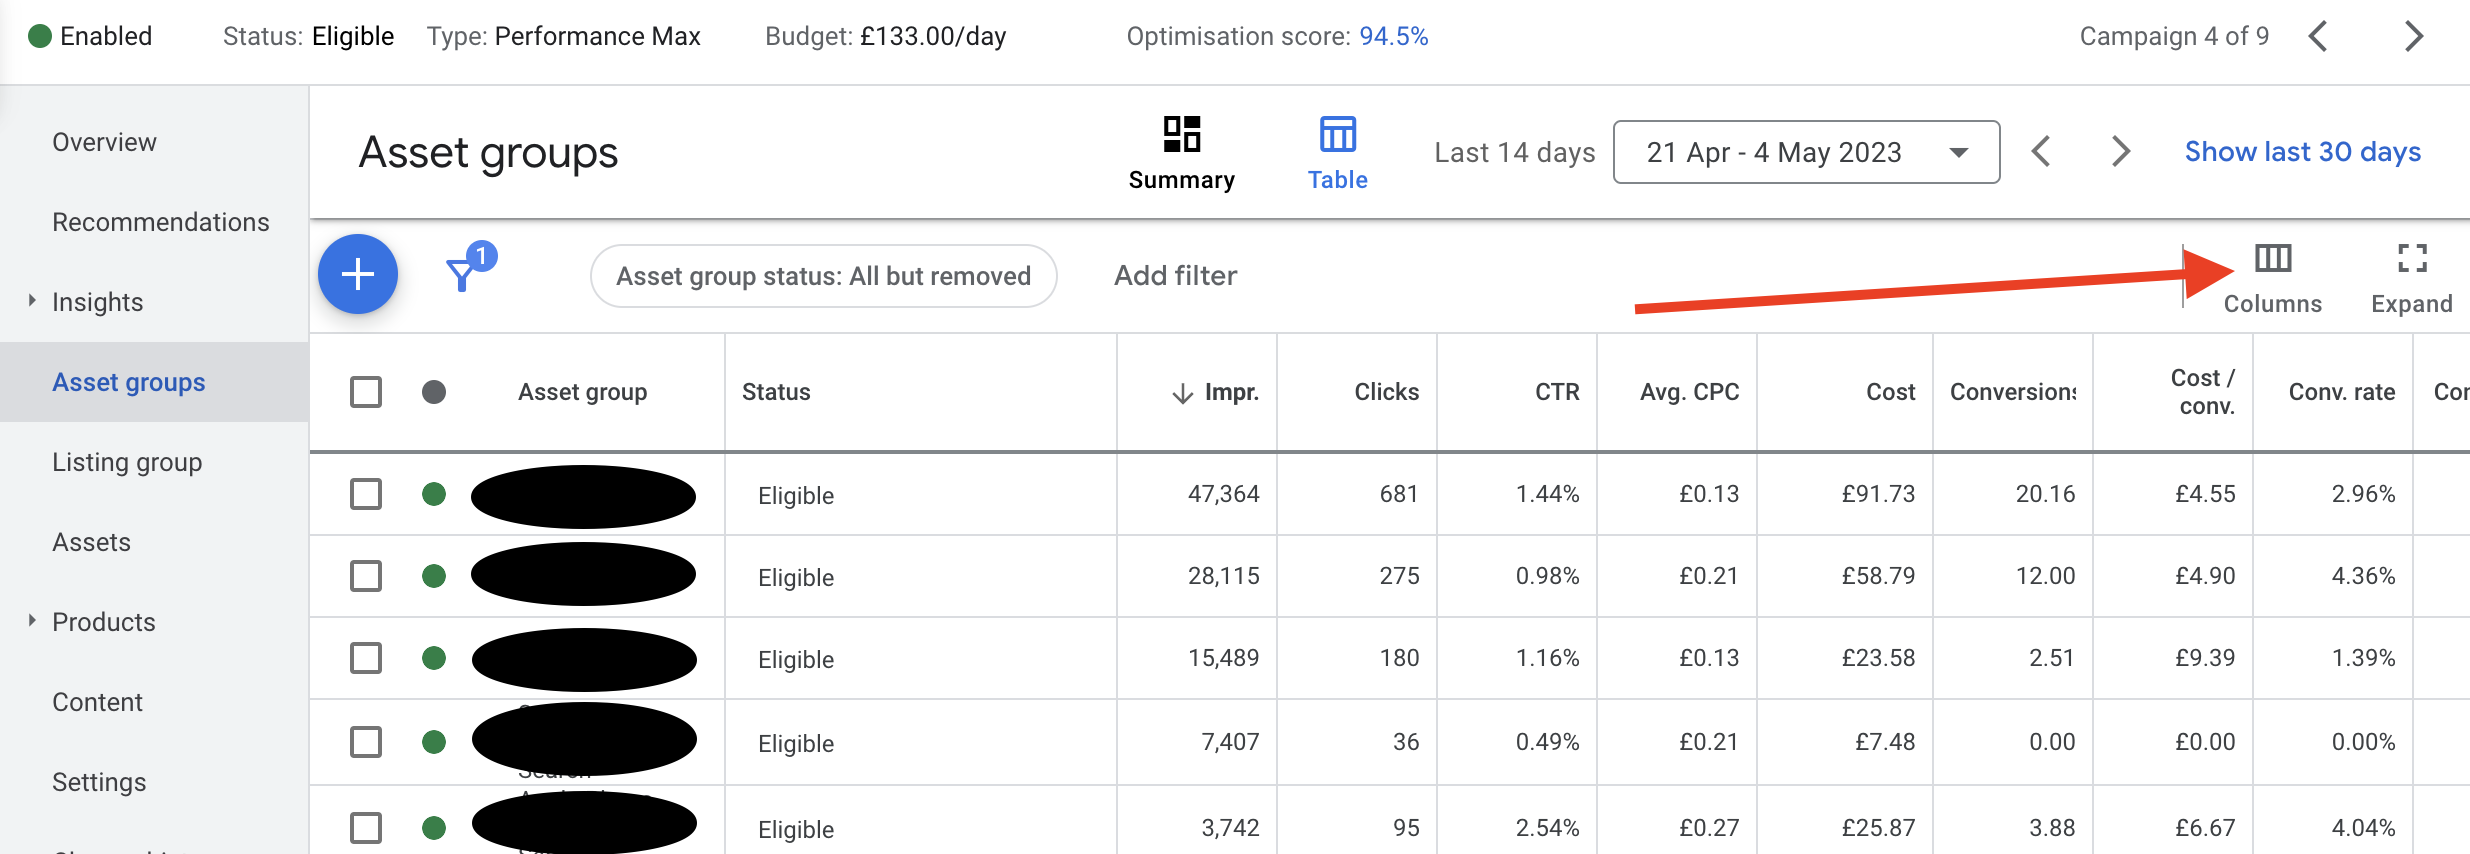
Following this, you'll see a basic table view of your asset performance. From here, click the 'columns' icon to modify your columns, and add all the metrics you want to see, impressions, clicks, Click through rate, conversions, conversion rate etc. Now you can see your performance by asset group, and you'll be able to assess overall performance when you test scaling into new audiences and update your ad assets.
Performance Max Consumer Spotlight > The Search Categories Report
Below the summary box mentioned above, you will find the Consumer Spotlight section, and the first bit of data here will be search terms that have triggered your ads. These are grouped into categories, with the number of searches that occurred for each category, along with the corresponding conversion value and a rough estimate of search volume relative to the last seven or 28-day period you are viewing. Neat huh?
This helps you understand performance in search but does not show the actual landing pages people see. So remember that you won't be able to see the context for how the search queries might apply and what your audience saw when they clicked through your ad and landed on your website.
However, you can gain insight into the number of conversions for each theme and search term and what audiences are using these searches, which we'll return to. You can also map out scenarios, get a view of where your campaigns are in their development of seeking new sales, and identify new search opportunities. Are your search queries very bottom-of-funnel (maybe brand traffic) or higher funnel types of searches?
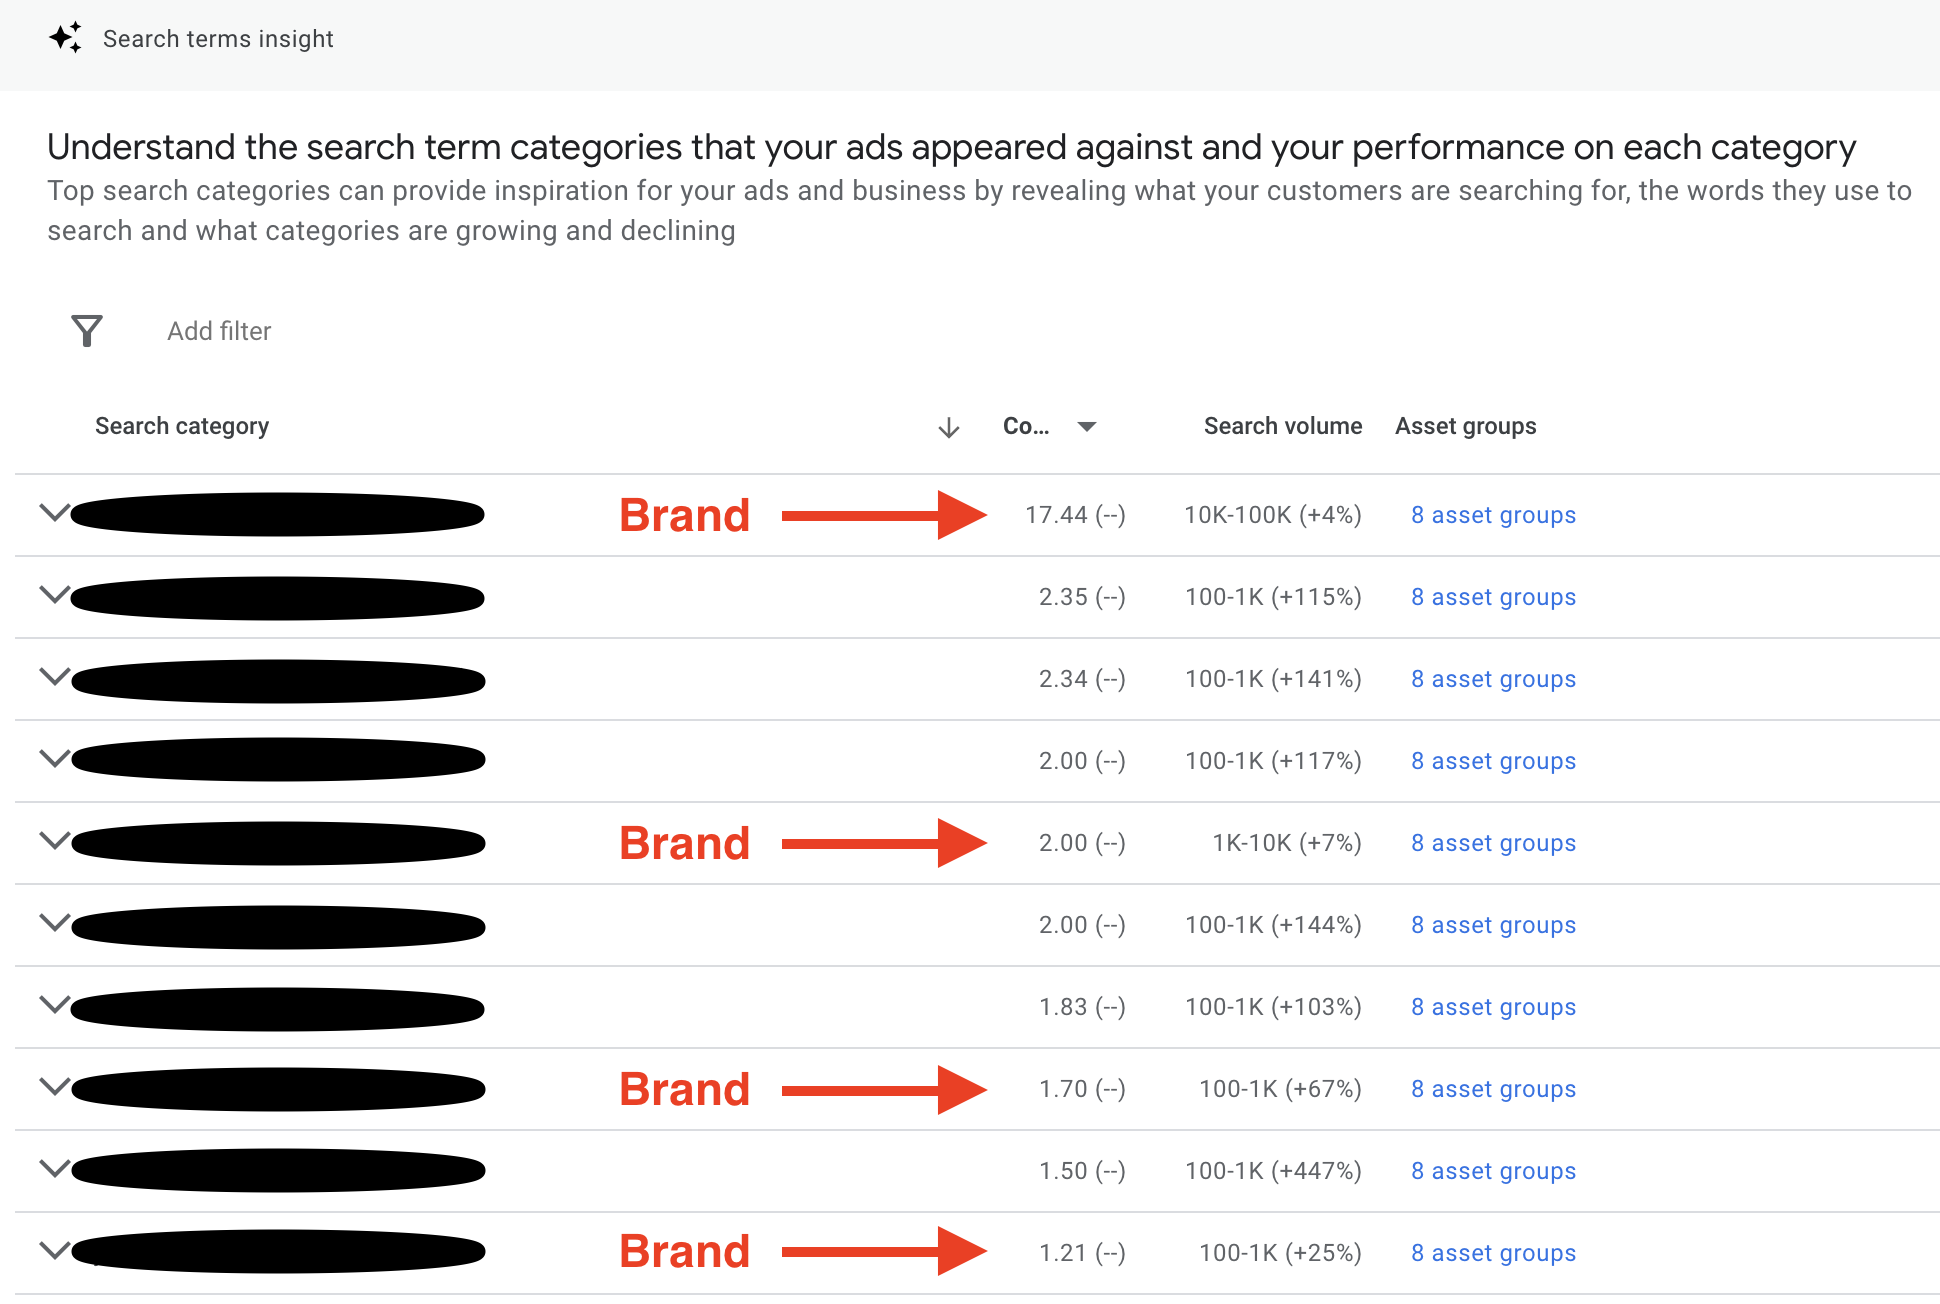
Let's map out a potential scenario for using the search query report. You are in the early stages of a new Performance Max campaign and see heavy traffic from search queries relating to your brand. And most of the conversions are coming from these brand terms. The screenshot below shows that most conversions are for brand search queries, with few non-brand queries contributing to conversions.
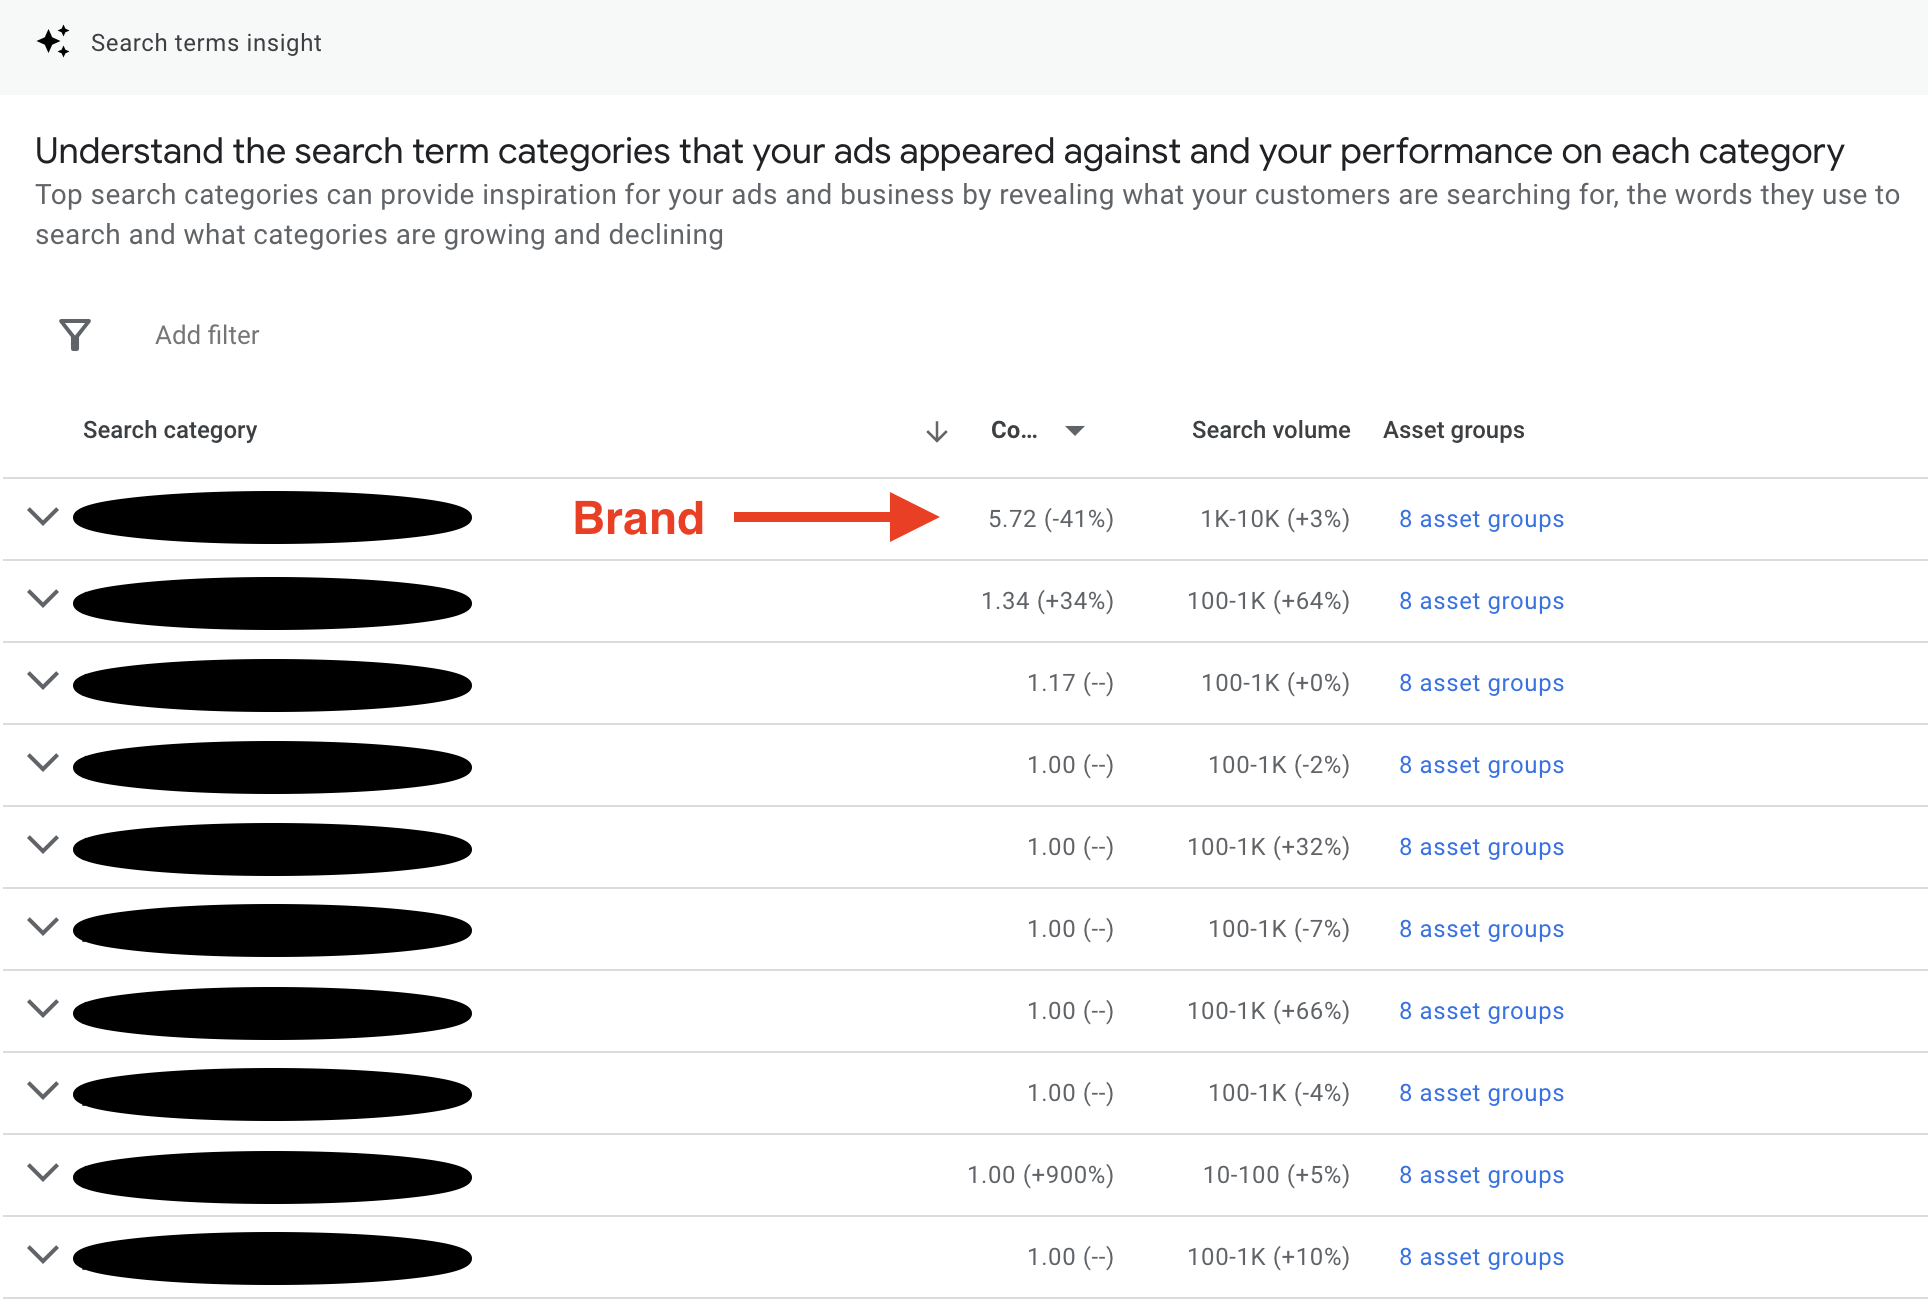
As Performance Max runs a little longer, gathers data, and optimises, you can see that it begins to look for sales in higher funnel search queries, with the number of clicks and conversions for brand search queries reducing and more conversions from outside of this, shown in the following screenshot example below. Not only are there fewer instances of brand search queries, but the conversions associated with brand searches are falling, with a dramatic increase in conversions for non-brand search queries. What does this tell us? We can see that PMax is learning who to go for in generating sales and has likely used the data from our brand traffic audience to scale up into colder audiences and become more valuable in the acquisition of sales.
When using this report, you'll have to bear in mind that you can only view data for the last 7 or 28 days. You can't specify date ranges (at present). So regular review and making notes on what's observed is necessary to get an idea of what's happening inside your Performance Max campaign.
Additionally, search queries can be used to understand how consumers are finding your website and can provide inspiration as to how you might better optimise your ad copy for audiences searching in specific ways and inspire ideas on how you can improve the content on your website.
Search Queries In Performance Max Asset Groups
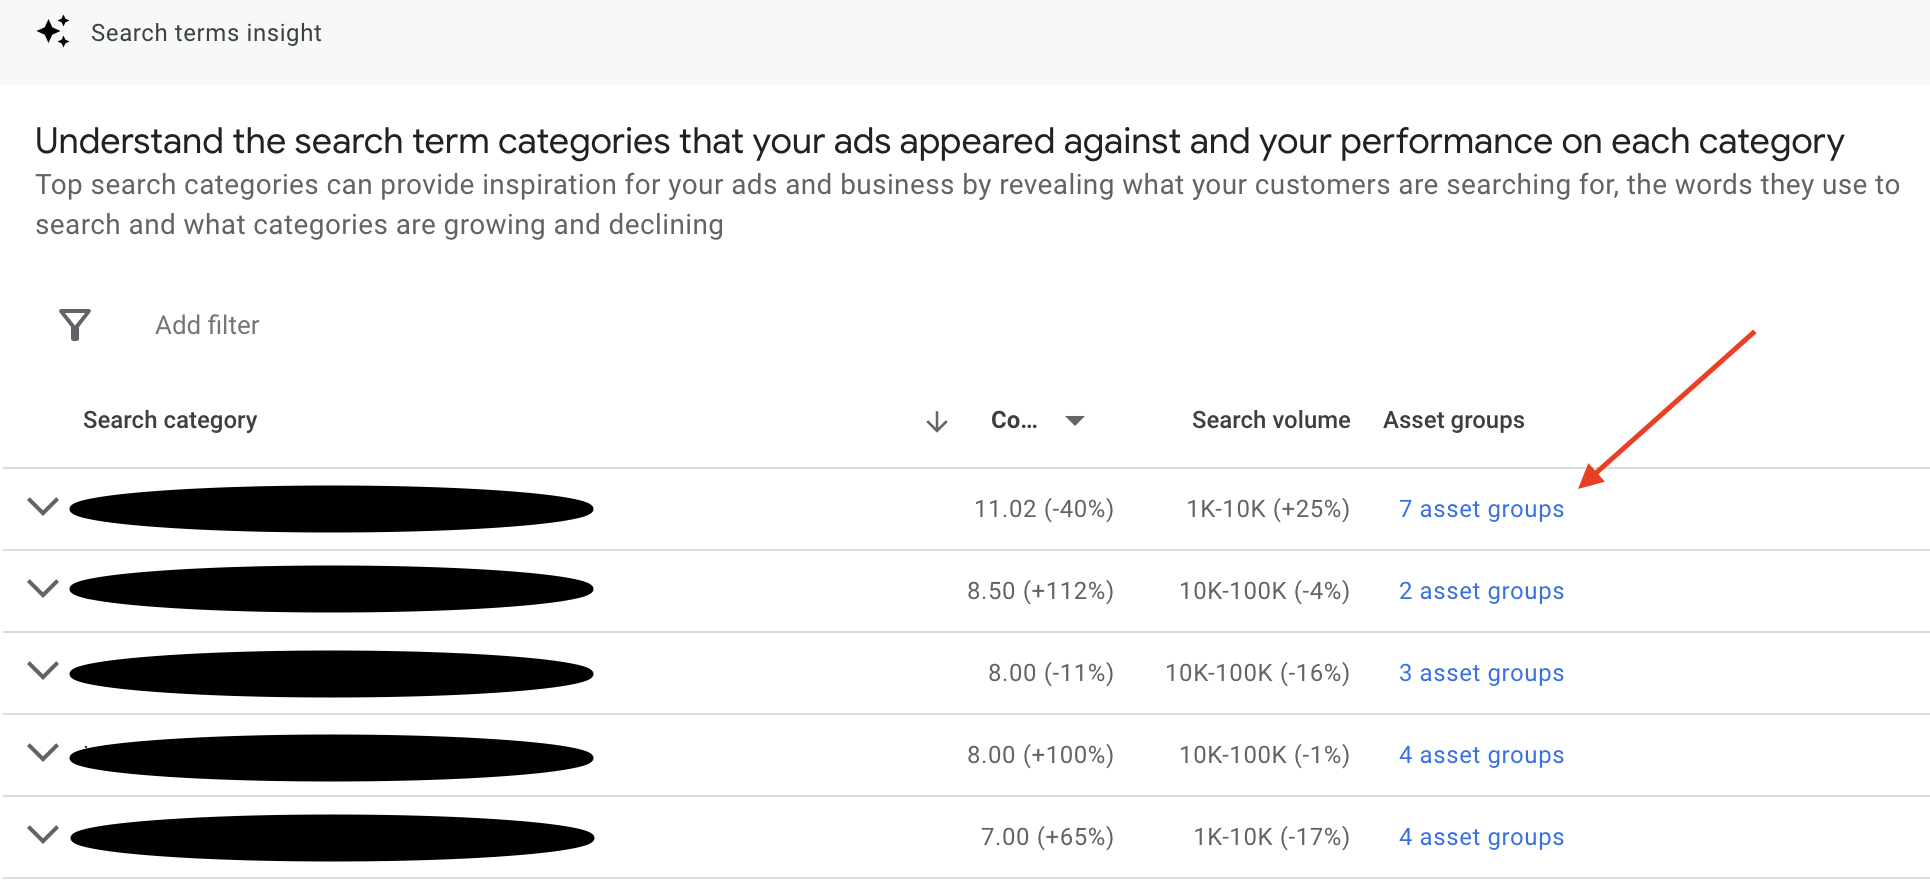
To go a step further with search query review, it's possible to see what search query categories are popular within your asset groups. Next to each search category, you should see a column headed 'Asset Groups', which indicates how many of your asset groups the search query has applied. If you click this column, you will be presented with a list of the asset groups that interacted with the search query.
This might be particularly useful if you have broken out your Listing Groups from your static ad assets and structured them carefully around your catalogue and applicable audiences. You can gain insights into how Performance might be scaling into Paid Search Ads and use this in optimising your ad assets for each asset group.
Performance Max Consumer Spotlight > Audience Insights Report
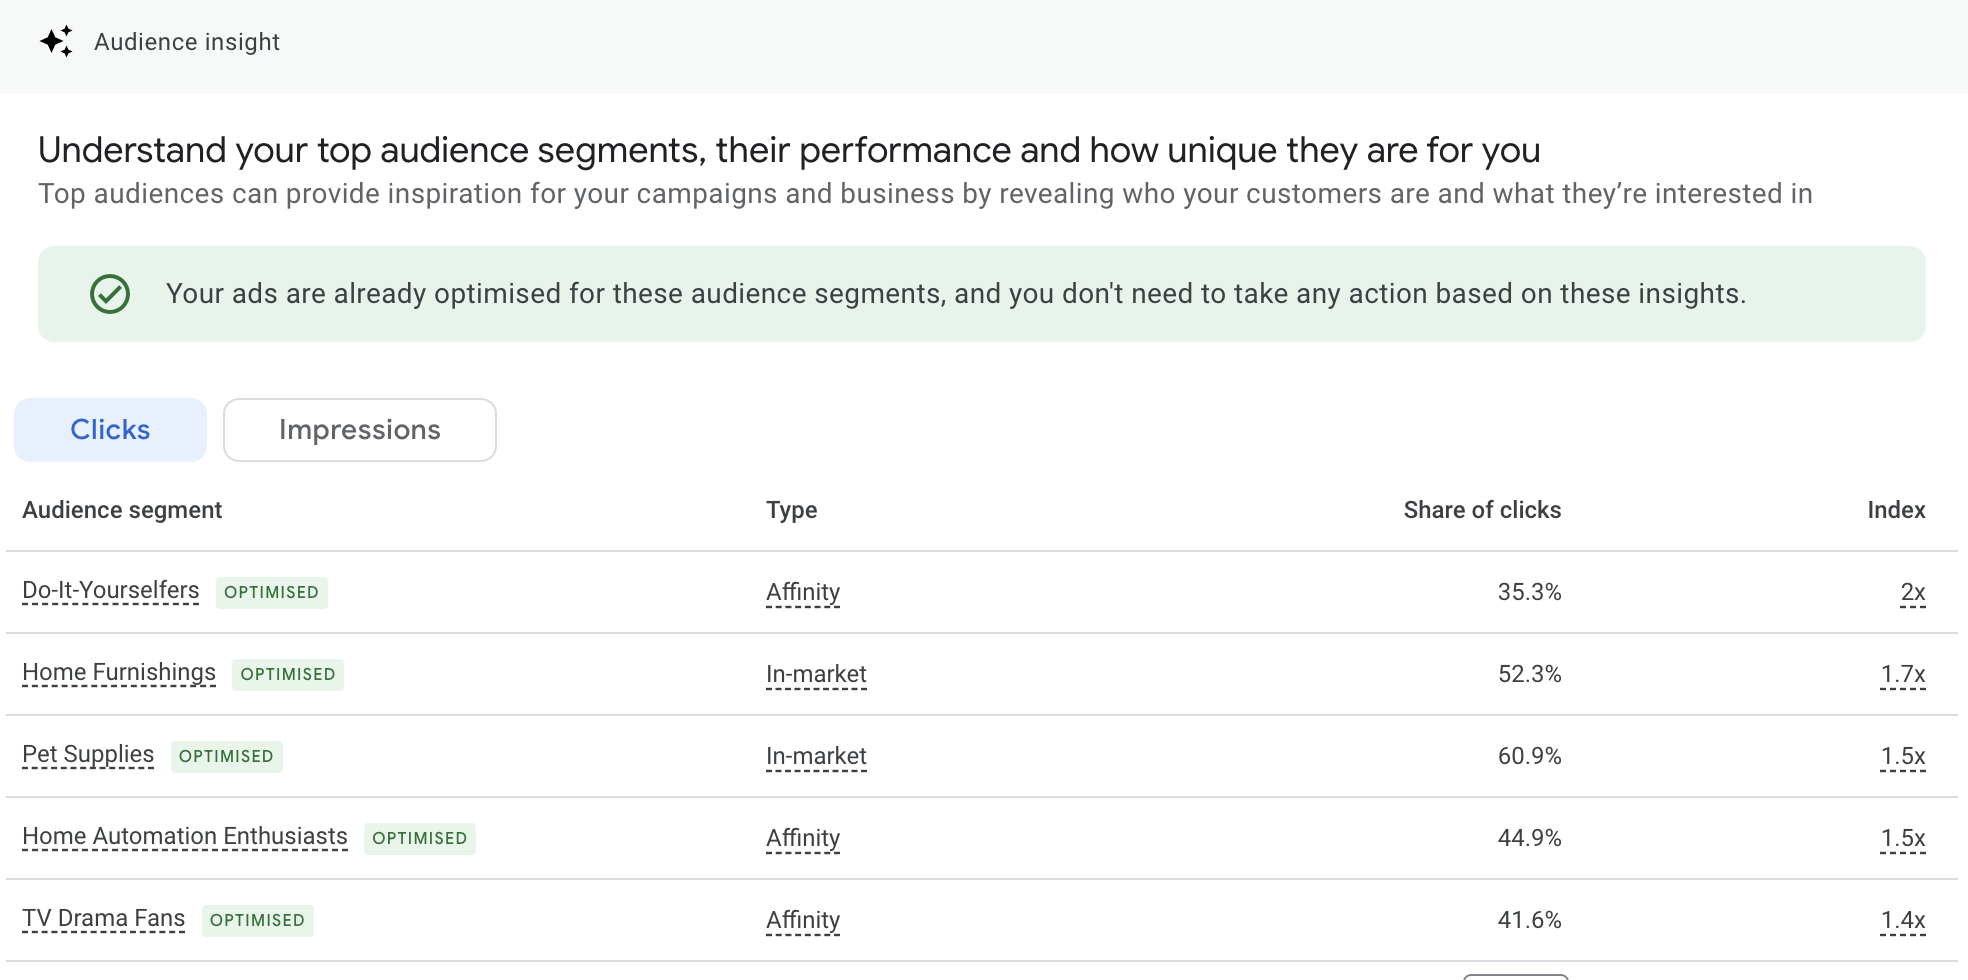
The Audience Insights report provides valuable information about what audience categories Performance Max is going for, known as audience signals. This may offer ideas on how to adapt your ad copy, product development, landing pages, and video for different market segments. Performance Max's share of conversions, clicks, and impressions are also shown, allowing you to optimise for these segments by audience category.
Some of the audience signals may be ones you have set, while others may be new ones that Performance Max has identified as potential and scaled into them. Your job is to use this data for inspiration to improve your assets and landing pages to meet the needs of these audiences. This may mean introducing new asset groups and specific messaging you had not initially considered.
Some of the audience signals you see may make complete sense, while others may not. Remember that the market dictates, and Google is going after what generates sales to meet your goals.
Auction Insights Report In Google Performance Max
So far, we've covered who you are advertising to. Next, we'll cover who you compete against in the Google ad space. Auction Insights are great for understanding the competitive landscape of Google Ads, and it allows you to compare your presence against that of your competitors in Search or Shopping results.
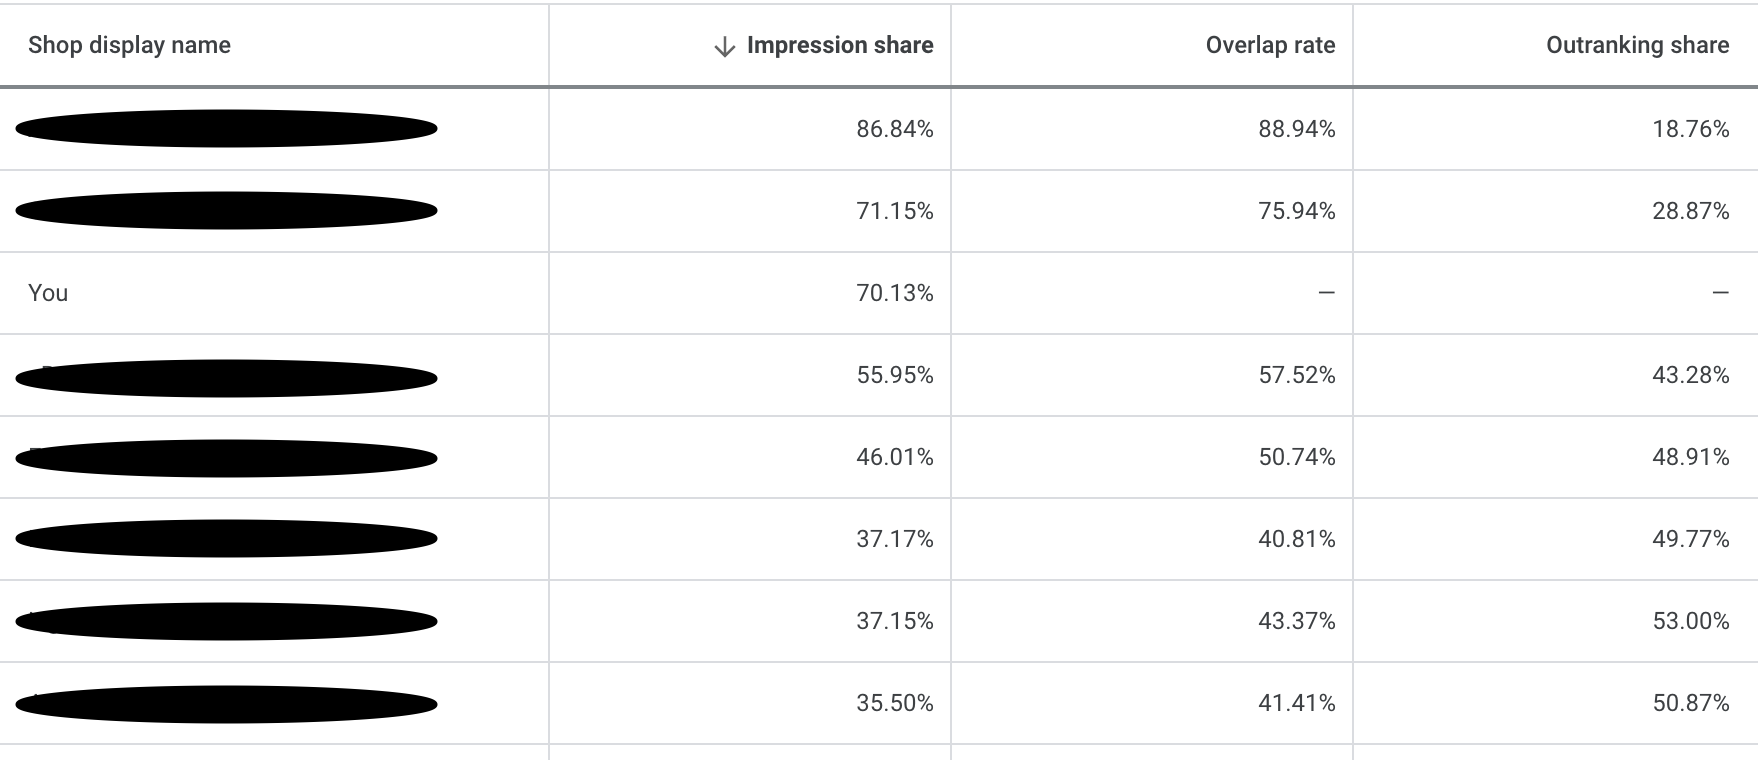
In this report, you can toggle date ranges more specifically to see how your Search Impression Share changes over specific periods. This is important to note, as adjustments to Assets may reduce ad relevance for crucial search queries, so it is a vital piece of the puzzle regarding Performance Max diagnostics.
With Auction Insights, you can better understand your competition, adjusting your Ads, bidding strategy and budgets to maximise performance.
Performance Max Placement Reports
The Placement Reporting within Performance Max campaigns allows you to see 'where' your ads were served and the number of impressions they had on each placement outside of the Google search engine. Data is currently limited, but this may help you make informed decisions to scale or improve campaigns.
To find your Placement Report, Go to 'Reports > 'Predefines reports (Dimensions') > 'Other'> 'Performance Max campaigns placement.'
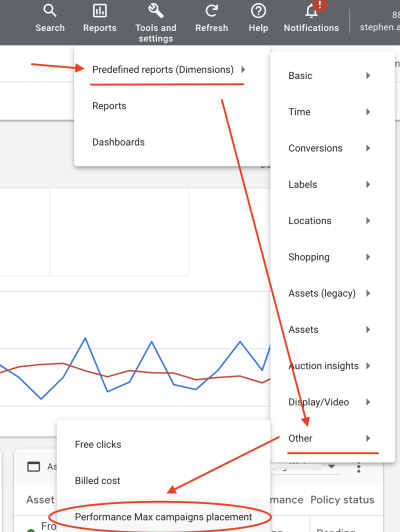
Here, you'll see a report of all the websites on which your Performance Max campaigns have placed ads. You can toggle your period viewed and even layer with campaign name data to filter further to see the placements for a single campaign.
It's important to remember that Performance Max bids on audiences, not placements, so if you are meeting your campaign goals (Your ROAS or Cost Per Action targets), you should be okay. Additionally, you can review these websites in your placement reports against your Audience Insights to identify common interests or problems they are trying to solve, which may help uncover new ideas for asset, audience, and website content development opportunities.
Hidden Reporting Of Performance Max
That's most of the easy-to-find reports covered for Performance Max. However, there might be some others you've not found, yet think about how much it would help if you could dig just that little bit deeper.
Traffic By Device Reporting For Performance Max
With no way to see the performance by device type in Google Performance Max campaigns, you'll have no option but to use Google Analytics 4. The good news is this is relatively easy to find, as there is a standard report for statistics by device type called 'Tech Details' under Tech in the main reports menu.
In the table view, ensure you have 'Device Category' selected in the leftmost column, as shown in the screenshot below.
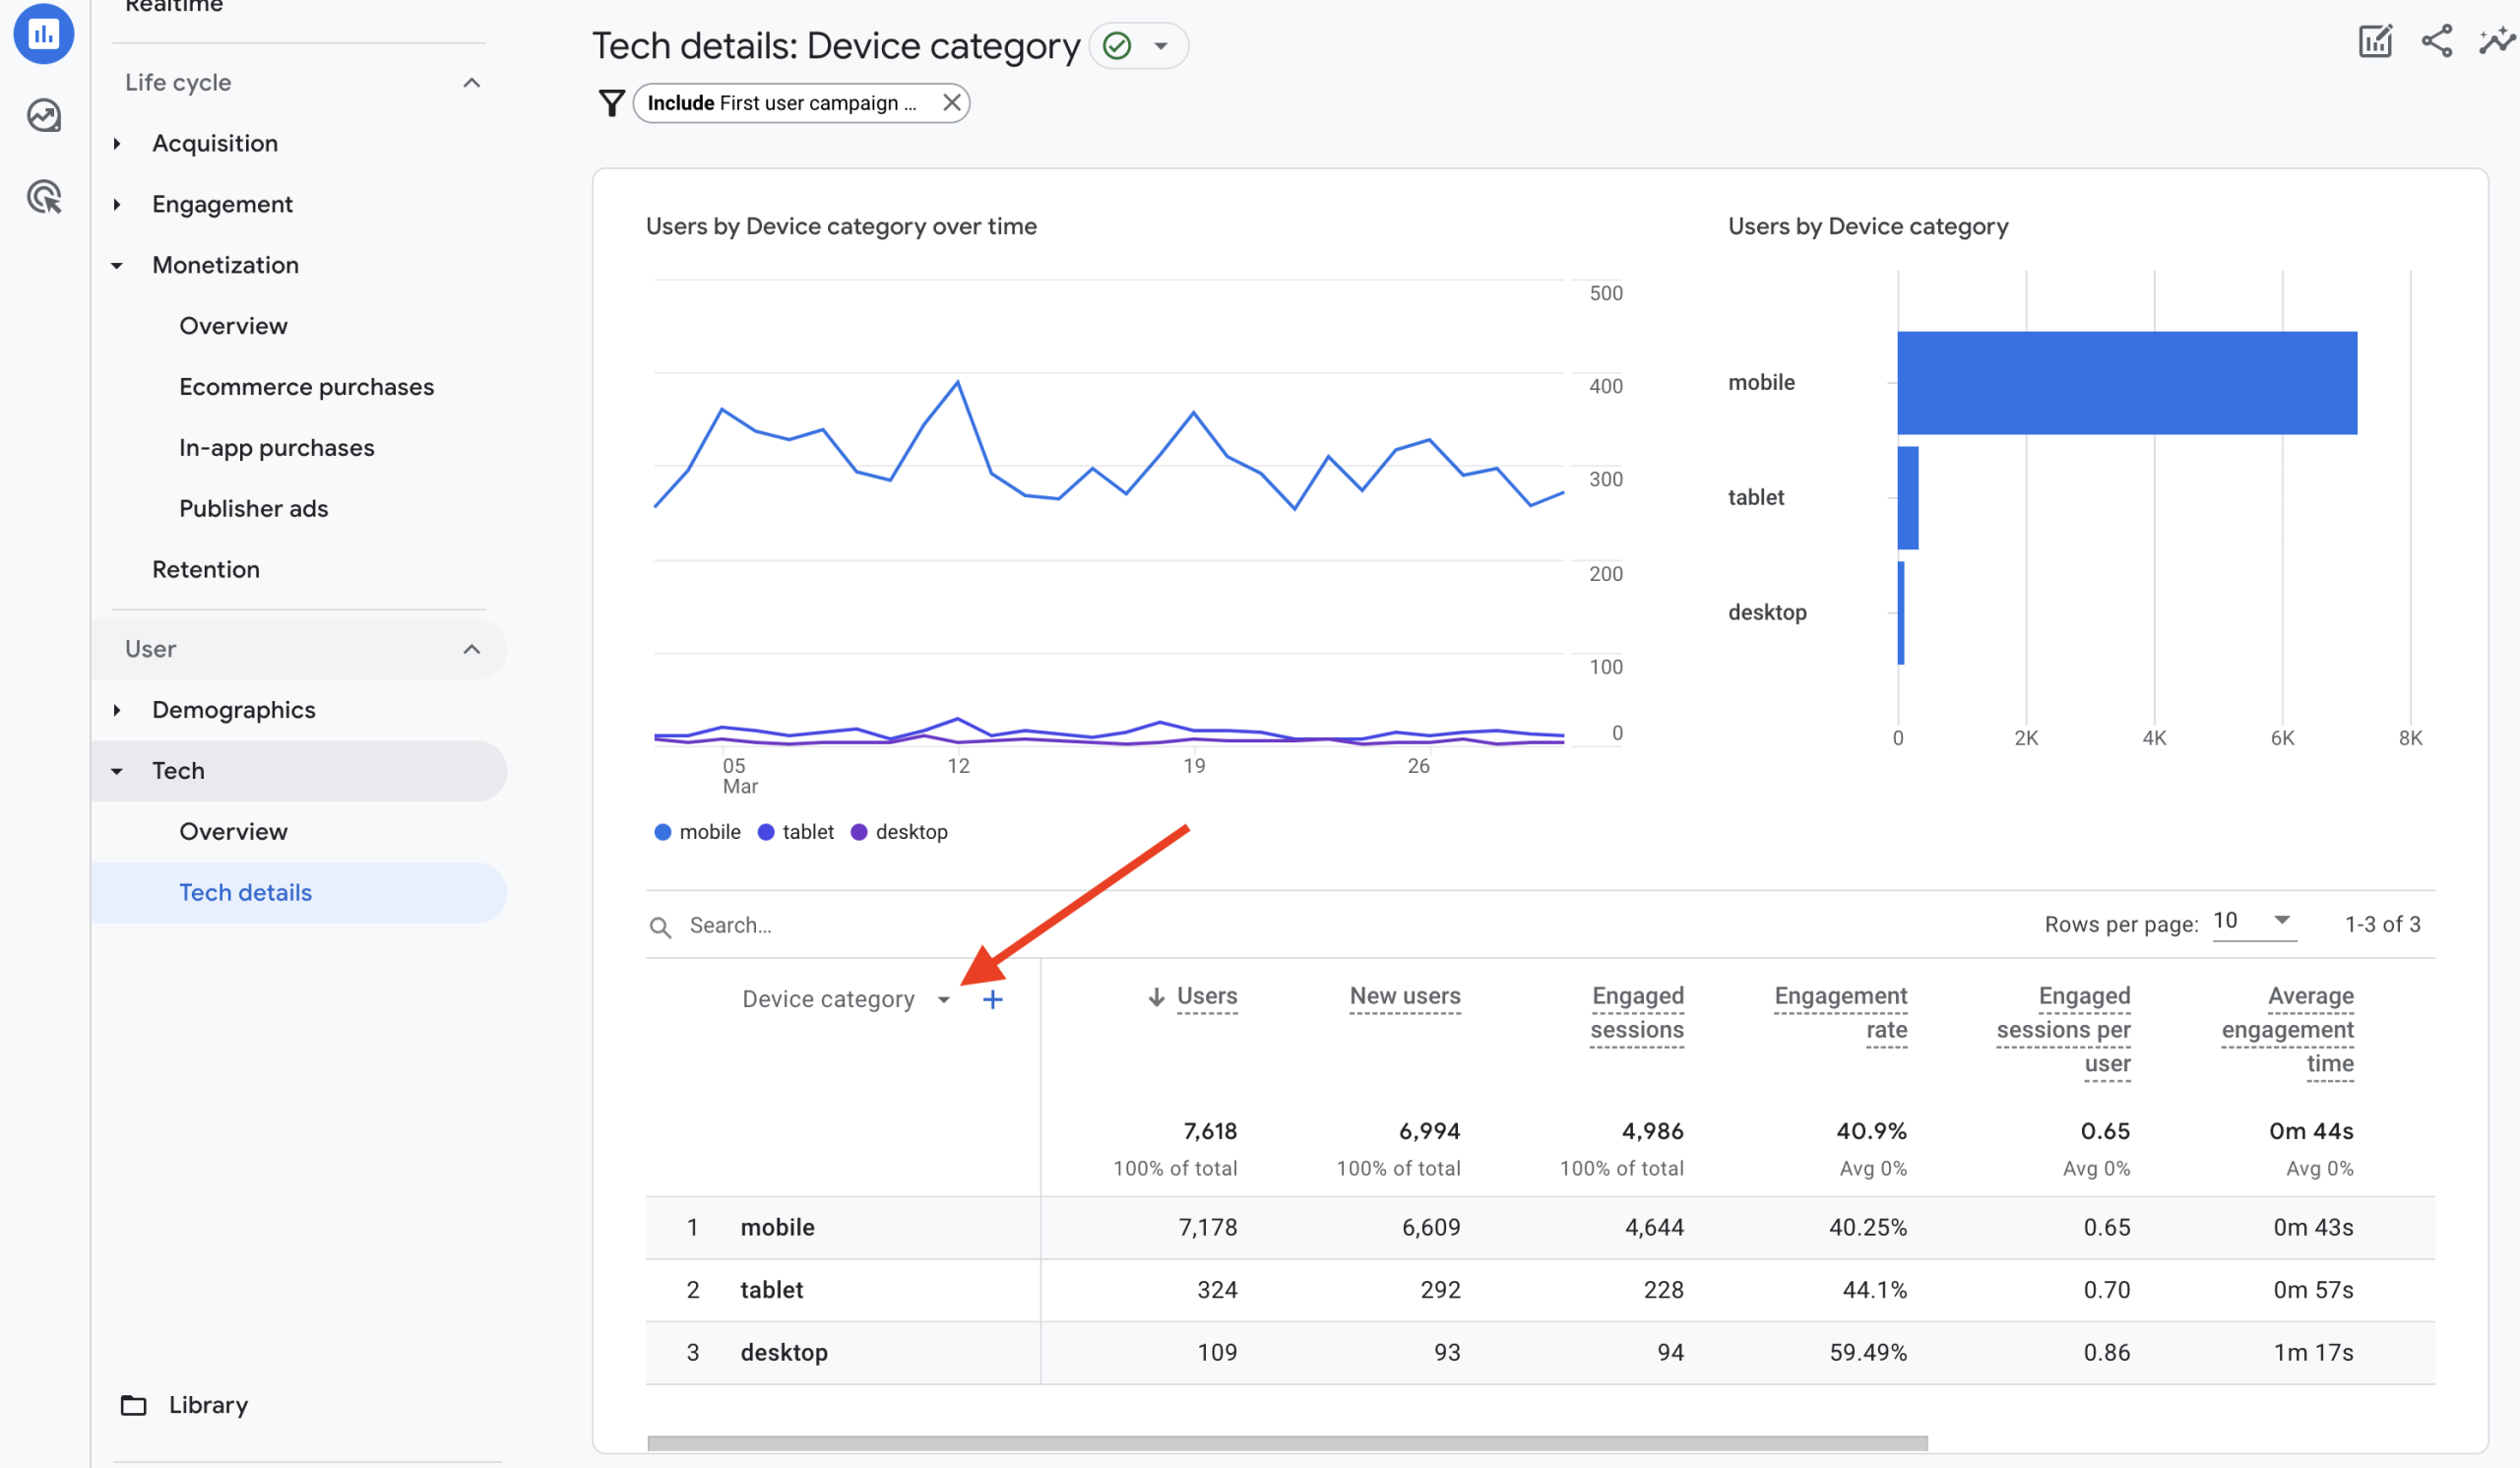
By default, this data is for all traffic sources, so you'll need to apply a filter to get a view of device data specific to your Performance Max campaign(s).
Adding a filter for 'First User Campaign' and selecting the Performance Max Campaign(s) for which you want to review data in the drop-down will give you a view of traffic by the device you want.
Why 'First User Campaign' And Not 'Session Campaign'? This comes down to how conversions are attributed to the data you are looking at. First User Campaign uses first-click attribution, so helpful in seeing how first touch points led to sales. You can, however, take the view of 'Session Campaign' to get a picture of the last-click touchpoints that led to the final sale.
You are now wondering why there is any point in looking at traffic by device when there are no device bid adjustment features in Performance Max, and the bidding strategy should take care of everything for you. For the most part, this is true. However, what about when you are trying to diagnose those days of poor sales performance? Traffic all looked fine, with no issues with assets and maybe no significant changes made, yet you saw a period where sales just dropped off for no apparent reason. A change in the patterns of traffic by device type may explain this.
Landing Page Report In Performance Max
The Google Ads reporting features available in Performance Max are constantly evolving. When the platform was first launched, the only way to report on landing pages was to use Google Analytics. At the time of writing, there isn't a specific landing page report you can access in any campaign, but a custom report can now be created in the Google Ads reports section as a workaround.
Head to the reports section in Google Ads (not pre-defined reports) and click the button to create a custom report.
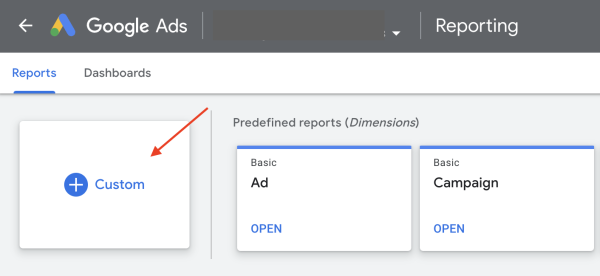
You'll need to add two headings as rows: Campaign and Landing Page, and then add your column metrics such as clicks, impressions, CTR, conversion rate, and revenue.
To filter the report to view landing page data for a specific Performance Max Campaign(s), click 'Filter' at the top right, select your Performance Max campaign, then click 'Apply'. The resulting view will show metrics for each landing page associated with the given campaign.
It's important to note that these will be for all ad formats, so performance may differ depending on which landing page PMax is using for each ad. If you identify any pages that you believe are causing a problem, excluding them from PMax as a landing page will improve performance. In that case, you can use this data to add pages to the landing page exclusions in your Performance Max campaign settings.
Need Help With Your Performance Max Ads?
This concludes our blog post about Google Ads Performance Max Reporting. We hope you find this a great resource and put you on a path to better understanding what's happening in your Performance Max campaigns. We're sure we'll see new and added reporting capabilities from Google in the coming months. If you want further information about Performance Max campaigns, our Complete Beginner's Guide to Google Performance Max should offer some great reading.
With hundreds of campaign metrics to consider, Google Performance Max campaigns are designed to assist with optimising using machine learning models to meet your business goals. This doesn't mean you can set and forget, and you'll still need to stay on top of Google Performance Max management, applying those critical insights that only you, as a human and business owner, can use that Google won't see.
Specialist Performance Max agencies use their knowledge of the Google Ads platform and their years of experience to focus on the critical data points and strategies according to the needs and objectives of the business. If you are a retail business in need of help with Google Performance Max, why not have a chat with us about your goals and see how we can help, get in touch.
Book A Discovery Call
Looking for tailor-made PPC strategies? Our team is here to help you maximize your online store's potential. Book a discovery call with us for personalised insights and solutions.
Book Your Free ConsultationBook Your Call